Fig. 4
- ID
- ZDB-FIG-230313-23
- Publication
- Wu et al., 2021 - Methylome inheritance and enhancer dememorization reset an epigenetic gate safeguarding embryonic programs
- Other Figures
- All Figure Page
- Back to All Figure Page
|
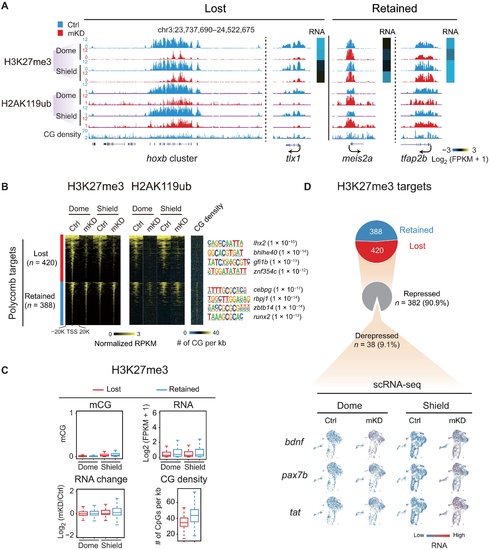
dnmt1 mKD results in defective Polycomb domain establishment.(A) UCSC Genome Browser snapshot showing H3K27me3 and H2AK119ub of control (blue) and dnmt1 mKD (red) embryos at dome and shield stages. Heatmap showing RNA expression of related genes. (B) Heatmaps showing the normalized H3K27me3 and H2AK119ub enrichment around promoters (TSS ± 20 kb) of Polycomb target in control (blue) and dnmt1 mKD (red) embryos at dome and shield stages. CG density and enriched TF motifs are shown too (right). (C) Box plots showing promoter mCG, RNA, and CG density levels for two clusters of Polycomb targets [lost (red) and retained (blue), defined in (B)] at dome and shield stages of control (top). RNA changes between control and dnmt1 mKD embryos (RNA change) are also shown (bottom left). (D) Pie chart showing the percentages of Polycomb target genes with lost or retained H3K27me3 in dnmt1 mKD embryos at shield stage and, among “lost” group genes, the percentages of genes that are derepressed [log2FC (mKD/Ctrl) > 2] and remain repressed (gray) (top). The feature plots of scRNA-seq show RNA expression of example derepressed genes in control and dnmt1 mKD embryos at dome and shield stages (bottom). Each dot indicates one cell. Red, high expression; blue, low expression. |

