
FIGURE
Fig. 4
- ID
- ZDB-FIG-230228-287
- Publication
- Shirai et al., 2023 - Microarray transcriptome datasets of maternal-zygotic DNA methyltransferase 3aa-/- zebrafish during early developmental stages
- Other Figures
- All Figure Page
- Back to All Figure Page
Fig. 4
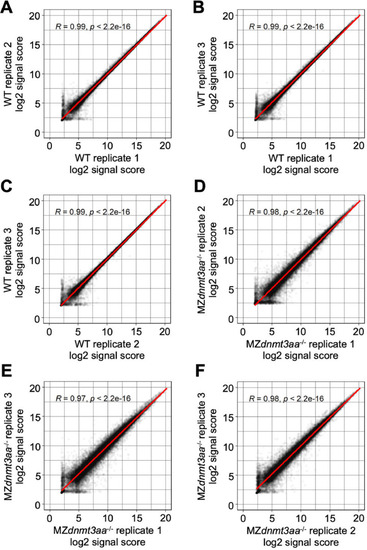
Correlation graph of log2 signal score between replications in shield stage samples. Each dot indicates the signal score of each gene and the red line shows the linear regression. |
Expression Data
Expression Detail
Antibody Labeling
Phenotype Data
Phenotype Detail
Acknowledgments
This image is the copyrighted work of the attributed author or publisher, and
ZFIN has permission only to display this image to its users.
Additional permissions should be obtained from the applicable author or publisher of the image.
Full text @ Data Brief