
FIGURE
Fig. 5
- ID
- ZDB-FIG-230225-14
- Publication
- Wang et al., 2022 - Cold Acclimation for Enhancing the Cold Tolerance of Zebrafish Cells
- Other Figures
- All Figure Page
- Back to All Figure Page
Fig. 5
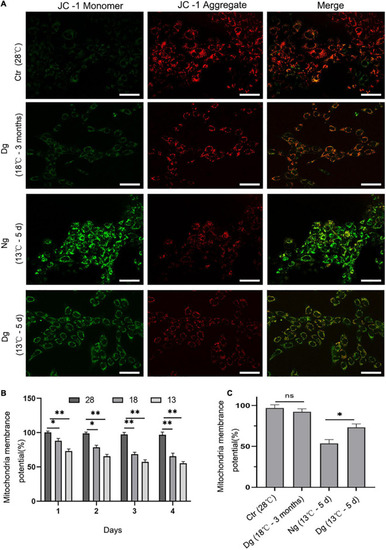
The effect of cold stress on mitochondrial membrane potential. Ctr, the control group; Dg, the domesticated group; Ng, the non-domesticated group. (A) Representative images were scanned by a confocal microscope after staining with JC-1. The red fluorescence indicates high mitochondrial membrane potential, while the green indicates low mitochondrial membrane potential. Scale bar = 50 μm. (B,C) Quantitative results of mitochondrial membrane potential by flow cytometry. Each experiment was performed in triplicate. The results are presented as the mean ± SD (n = 3); *P < 0.05, **P < 0.01. |
Expression Data
Expression Detail
Antibody Labeling
Phenotype Data
Phenotype Detail
Acknowledgments
This image is the copyrighted work of the attributed author or publisher, and
ZFIN has permission only to display this image to its users.
Additional permissions should be obtained from the applicable author or publisher of the image.
Full text @ Front. Physiol.