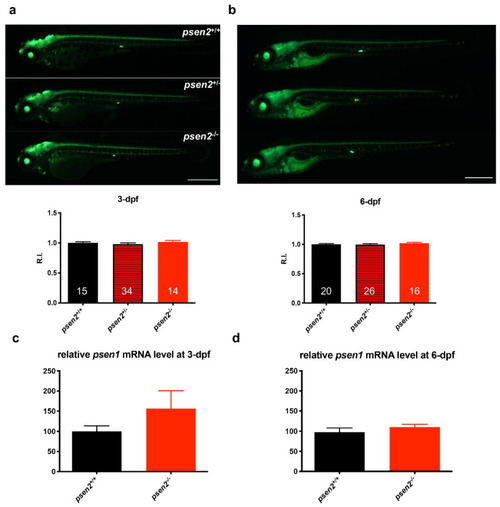
Effect of Psen2 absence on Notch signaling and psen1 expression at early developmental stages. (a,b) Representative images and relative fluorescence quantification of psen2+/− incross progeny in Tg(EPV.Tpi–Mmu.Hbb: EGFP)ia12 transgenic background, both at (a) 3- and (b) 6-dpf. Genotyping was performed after image acquisition. Values represent the mean ± SEM. Data were generated from 3 independent experiments. R.I. = Relative Intensity. Scale bar: 500 µm. Statistical significance was determined by one-way ANOVA test. (c,d) Quantification of relative psen1 mRNA level in both (c) 3- and (d) 6-dpf psen2+/+ and psen2−/− larvae. Values represent the mean ± SEM. Data were generated from 3 biological replicates for each condition. Statistical significance was determined by two-tailed Student’s t-test.