
Figure 3.
- ID
- ZDB-FIG-230213-9
- Publication
- Thomson et al., 2022 - Gigapixel imaging with a novel multi-camera array microscope
- Other Figures
- All Figure Page
- Back to All Figure Page
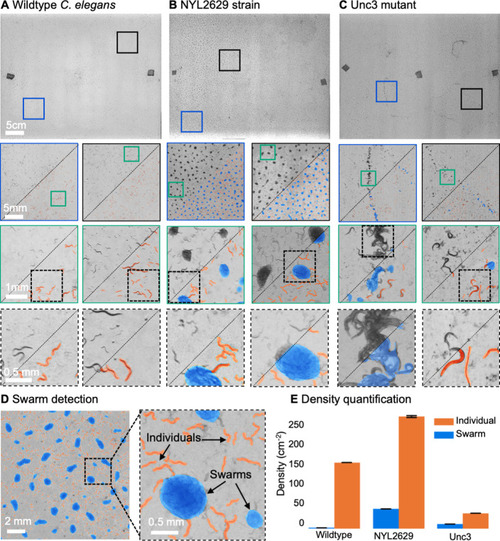
(A) Wild type C. elegans (N2 line) spread across the entire arena uniformly. Consecutive zoom ins show no significant swarming behavior. Approx. 30,000 organisms resolved per frame (similar imaging experiment repeated 4 times). (B) NYL2629 C elegans strain shows a periodic tiling of the petri dish over the majority of the arena as C. elegans form swarm aggregates that can be automatically detected. Approximately, 58,000 organisms resolved per frame. (C) Unc3 mutant C. elegans exhibit large wavefront swarms of activity, without the periodic tiling seen in the NYL2629 strain. Unc3 genotype inhibits a significant swarming behavior and causes swarms, annotated in blue, all over the entire arena. Our system provides sufficient resolution across a large field-of-view to enable studying behavioral patterns of C. elegans. In all cases the imaging was performed after day 3 of starting the culture. Videos 4–6 allow viewing of full video. Entire gigapixel video frames viewable online, ~8000 organisms resolved per frame. (D) Segmentation of swarms (blue) and individual C. elegans (orange) using a U-shaped convolutional network allows the automatic creation of binary identification masks of both individual worms and swarms. After segmentation, we used a pixel-connectivity-based method to count the number of objects (worms or swarms) in each gigapixel segmentation mask. (E) Bar graph quantifying density of worms within and outside of swarms for the different strains in A-C. Error bars indicate S.E.M across the arena. Mean worm density (number of worms/cm2) for wildtype 154+–0.254, NYL2629 262 +- 1.126, Unc3 36+–0.203. Mean swarm density (swarms/cm2) for wildtype 1.85+–0.01, NYL2629 45.92 +- 0.073, Unc3 10.65+–0.025. While more wild type worms than Unc3 are plated, wild type worms form far fewer swarms (p=2.3 x 10–66, Cohen’s d=0.96) 1 sided t-test. For more details, see Methods.
|