
Fig. 4
- ID
- ZDB-FIG-230213-4
- Publication
- Chiang et al., 2023 - HyU: Hybrid Unmixing for longitudinal in vivo imaging of low signal-to-noise fluorescence
- Other Figures
- All Figure Page
- Back to All Figure Page
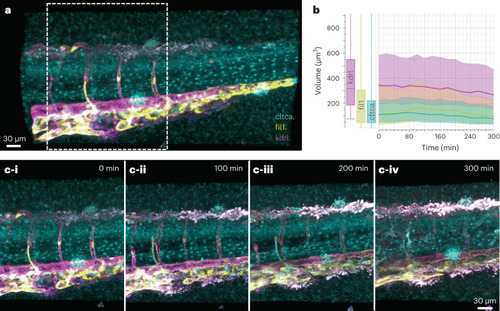
HyU reveals the dynamics of developing vasculature by enabling multiplexed volumetric timelapse.
a, HyU rendering for the trunk portion of a three-color zebrafish Gt(cltca-citrine);Tg(kdrl:mCherry;fli1:mKO2) at time point 0. b, HyU unmixed results allow for quantitative analysis and segmentation, here an example representing the time evolution of the segmented volumes of mCherry (vasculature, magenta), mKO2 (endothelial lymphatics, yellow) and citrine (clathrin-coated pits, cyan). Box and line plots were generated using ImarisVantage as described in Methods. n = 8.38 × 10⁴ surface objects. Center shows median; box represents the first and third quartiles; and whiskers represent the minimum and maximum. Shaded regions for line plots denote the interquartile range around the median. c, Timelapse imaging of the formation of the vasculature over 300 min (zoomed-in rendering of the box in a) at 0 (i), 100 (ii), 200 (iii) and 300 min (iv). The sample depicted is representative of ten experimental sessions each with two to three biological replicates, yielding similar results. |