
Fig. 3
- ID
- ZDB-FIG-230203-9
- Publication
- Odstrcil et al., 2021 - Functional and ultrastructural analysis of reafferent mechanosensation in larval zebrafish
- Other Figures
- All Figure Page
- Back to All Figure Page
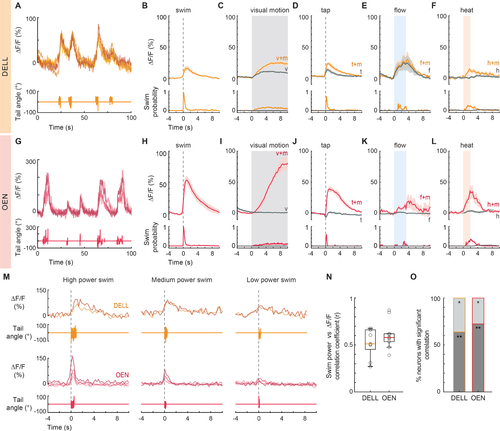
Activity of efferent nuclei during locomotion and in response to diverse sensory stimuli.
(A) Example traces of top: fluorescence activity (ΔF/F) of 4 DELL neurons in a single fish, and bottom: the animal’s cumulative tail curvature. (B-F) Top: Population activity (mean ΔF/F ± s.e.m.) of neurons in the DELL of GCaMP6s fish. Bottom: swim probability. (B) Average swim-triggered responses (n= 9 fish). (C) Average stimulus-triggered responses to moving visual gratings that elicited (v+m, orange) and failed to elicit (v, gray) swimming. (n= 11 fish). (D) Average stimulus-triggered responses to taps that elicited (t+m, orange) and did not elicit (t, gray) swimming (n= 7 fish). (E) Average stimulus-triggered responses to flow that elicited (f+m, orange) and did not elicit (f, gray) swimming (n= 3 fish). (F) Average stimulus-triggered responses during heat delivery events that elicited (h+m, orange) and did not elicit (h, gray) swimming (n=10 fish). (G) Example traces of top: fluorescence activity (ΔF/F) of 4 OEN neurons in a single fish, and bottom: the animal’s tail curvature. (H-L) Top: Population activity (mean ΔF/F ± s.e.m.) of neurons in the OEN of GCaMP6s fish. Bottom: swim probability. (H) Average swim-triggered responses (n= 8 fish). (I) Average stimulus-triggered responses to moving visual gratings that elicited (v+m, red) and failed to elicit (v, gray) swimming. (n= 7 fish). (J) Average stimulus-triggered responses to taps that elicited (t+m, red) and did not elicit (t, gray) swimming (n= 5 fish). (K) Average stimulus-triggered responses to flow that elicited (f+m, red) and did not elicit (f, gray) swimming (n= 5 fish). (L) Average stimulus-triggered responses during heat delivery events that elicited (h+m, red) and did not elicit (h, gray) swimming (n= 8 fish). (M) Fluorescence activity (ΔF/F) of single DELL (orange) and OEN (red) neurons during swims of high, medium, and low power. (n= 2 DELL and 4 OEN neurons. Nuclei imaged in different fish.) (N) Box plots showing the mean Pearson’s coefficients correlating the power of single swim bouts with the concurrent neuronal activity of efferent populations in individual GCaMP6f fish (circles, DELL: n= 9 fish, 2–3 neurons per animal; OEN: n= 10 fish, 2–9 neurons per animal). Medians shown in color. Plots derived from single-neuron analysis shown in Figures S3G and S3Q. (O) Percentage of cells per fish whose activity was significantly correlated with swim power. (DELL: n= 9, OEN: n= 10 fish; ** dark gray p < 0.001, * light gray p < 0.05). See also Figure S3. |