
FIGURE
FIGURE 2
- ID
- ZDB-FIG-230124-171
- Publication
- Scatterty et al., 2023 - Zebrafish aversion to infrasound in an open field test
- Other Figures
- All Figure Page
- Back to All Figure Page
FIGURE 2
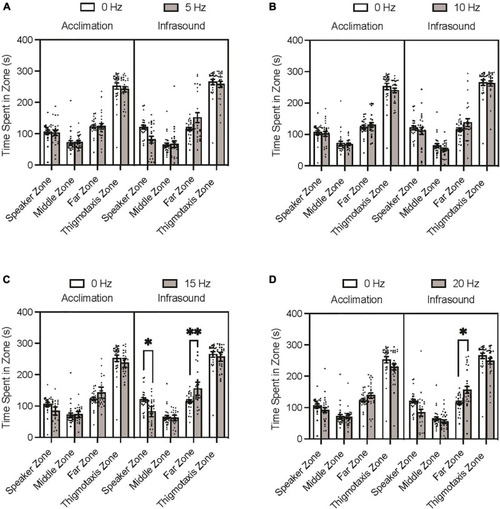
Zebrafish zone preference during acclimation and infrasound exposure trials. Fish were individually placed in the arena prior to the infrasound stimulus to record their baseline behaviour and then exposed to their respective frequency. (A) Average time spent in zones by 0 vs. 5 Hz fish. (B) Average time spent zones by 0 vs. 10 Hz fish. (C) Average time spent in zones by 0 vs. 15 Hz fish. (D) Average time spent in zones by 0 vs. 20 Hz fish. Data points represent individual zebrafish. Error bars represent S.E.M. *p < 0.05, **p < 0.01. |
Expression Data
Expression Detail
Antibody Labeling
Phenotype Data
Phenotype Detail
Acknowledgments
This image is the copyrighted work of the attributed author or publisher, and
ZFIN has permission only to display this image to its users.
Additional permissions should be obtained from the applicable author or publisher of the image.
Full text @ Front. Behav. Neurosci.