
Fig. 5
- ID
- ZDB-FIG-230123-5
- Publication
- Huang et al., 2023 - CRISPR-dCas13-tracing reveals transcriptional memory and limited mRNA export in developing zebrafish embryos
- Other Figures
- All Figure Page
- Back to All Figure Page
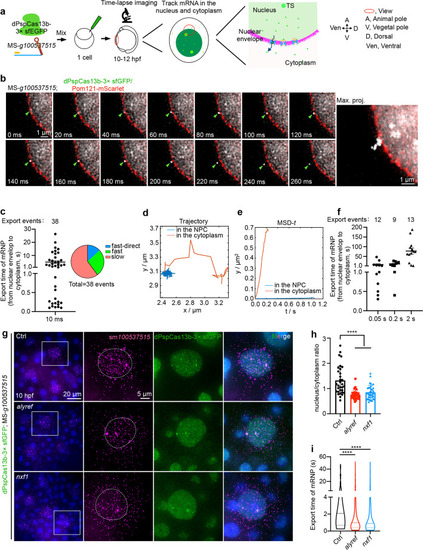
dPspCas13b/100537515 mRNP export via different patterns, which are modulated by Alyref and Nxf1. a A schematic view of the CRISPR-dPspCas13b tracked 100537515 mRNP motion in the nucleus and cytoplasm by time-lapse imaging. b Representative images of dPspCas13b-engaged 100537515 mRNP export, recorded every 10 ms. Pom121-mScarlet marks nuclear pore complexes (NPCs). Right panel, maximum time projection (max. proj.) of the movie shows the trajectory of mRNP export. Green arrowheads indicate mRNPs, see also Additional file 7: Movie 14. c Time of dPspCas13b/100537515 mRNP export displays a wide range. Left panel, graph depicting export time of all tracked mRNPs (n= 38) varies from 0.10 to 30 s. Right panel, graph shows the types of export events, including fast transport into cytoplasm less than 1 s (n=10) with directed transport via linearly traveling into cytoplasm (n=5), and slow transport into cytoplasm more than 1 s (n=23). d Graph depicting trajectory of slow transport event translocating from the nuclear envelope to the cytoplasm, with a significant dwell duration inside the nuclear envelope. e Two types of motions of mRNPs shown by the mean square displacement (MSD) of tracked export event in d versus time. The presence of two types of motions: diffusive movement (red line) in the cytoplasm and stationary diffusion (blue line) transporting through nuclear pore. f Time of dPspCas13b/100537515 mRNP export displays a wider range. Export time requirements of tracked mRNPs adopt different interval time for imaging, including 0.05 s (n = 12 from 38 cells), 0.2 s (n = 9 from 37 cells), and 2 s (n = 13, from 49 cells), ranging from 0.3 to 180 s. g Alyref and Nxf1 promotes mRNP export in developing embryos. Representative images of smFISH of 100537515 mRNP distribution in the nucleus and cytoplasm after injected the CRISPR-dPspCas13b system with transport factors mRNA, alyref and nxf1 at 10 hpf in fixed embryos. Scale bar 20 μm; white box indicates magnified area, scale bar 5 μm. h Statistical analyses show that Alyref and Nxf1 promotes mRNP export in developing embryos. Graph depicting nuclear/cytoplasm ratio of 100537515 mRNA in different group of examined EVL cells from about 10 developing embryos in g; n = 32, 33, 34 cells. i Alyref or Nxf1 overexpression shortens the time of dPspCas13b/100537515 mRNP export. The mRNPs were recorded at 50 ms per frame resolution. Export events: Ctrl, n = 86 (from 231 cells); alyref, n = 142 (from 255 cells); nxf1, n = 112 (from 272 cells). Mann-Whitney test was used; center dotted line, median; upper and lower dotted lines, 25% and 75% quartiles; **** p < 0.0001. In c, f, data are represented as mean ± SEM. In h, data are represented as mean ± SD; unpaired two-tail Student’s t test; **** p < 0.0001. Ctrl, control |