
Fig. 6
- ID
- ZDB-FIG-230118-39
- Publication
- Casteels et al., 2021 - An inhibitor-mediated beta cell dedifferentiation model reveals distinct roles for FoxO1 in glucagon repression and insulin maturation
- Other Figures
- All Figure Page
- Back to All Figure Page
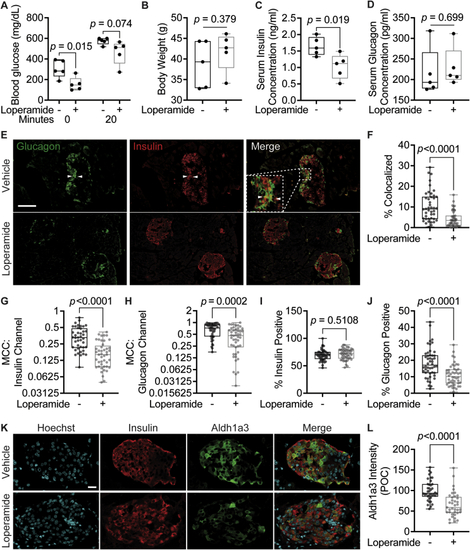
Loperamide has positive systemic and islet-specific in vivo effects in diabetic mice.A. Serum glucose concentrations after overnight fast (0 min) and 20 min after IP injection with 1 g/kg glucose (20 min). N = 5 mice/treatment. B. Body weight measured after 4-week treatment. C. Serum insulin concentration measured by ELISA. D. Serum glucagon concentration measured by ELISA. E. Representative immunofluorescence panel of pancreas sections stained with insulin and glucagon antibodies. White arrows point to insulin/glucagon double-positive cells. Scale bar = 100 μm. F-J. Quantifications of immunofluorescence images. N = 45 islets/treatment from five different mice/treatment. F. Percent of total islet pixel number representing colocalized red/green channel pixels. G-H. Thresholded Manders’ correlation coefficients for the insulin (red) channel or glucagon (green) channel per islet. I-J. Percent of total islet volume occupied by the insulin (red) channel or glucagon (green) channel pixels. K. Representative immunofluorescence panel of db/db mouse pancreas sections 4-week post-loperamide treatment, stained for insulin and Aldh1a3. Scale bar = 20 μm. L. Quantification of immunofluorescence images. Cytoplasmic Aldh1a3 intensity was only calculated within insulin-positive cells. POC = percent of control. N = 38 islets/treatment from five different mice/treatment. |