
Fig. 1
- ID
- ZDB-FIG-230117-2
- Publication
- Matsumoto et al., 2021 - Carbonic anhydrase inhibitor induces otic hair cell apoptosis via an intrinsic pathway and ER stress in zebrafish larvae
- Other Figures
- All Figure Page
- Back to All Figure Page
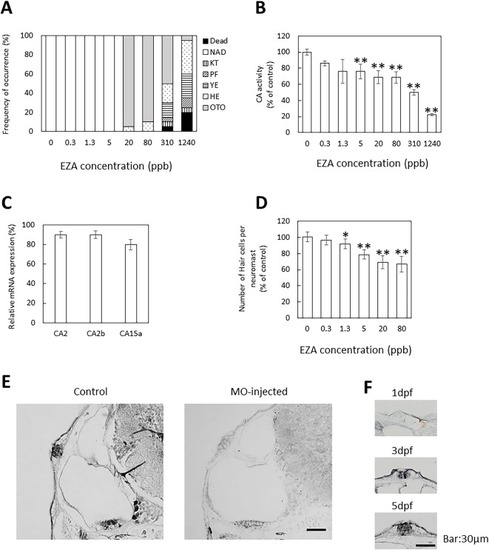
Effects of EZA exposure on CA activity and otic neuromast development and location of CA in otic neuromasts. (A) Effects of EZA during zebrafish development. Analysis was performed at 3 dpf; 20 embryos were observed for each dose. The values are percentage of abnormal embryos. NAD, no abnormality detected; KT, kinked tail; PF, irregular pectoral fin; YE, Yolk edema; HE, Heart edema; OTO, small otolith. (B) Effects of EZA on CA activity. CA activity in the cytosol fraction of larvae treated with various concentrations of EZA for 3 days was measured at 3 dpf. (C) Effects of EZA on CA mRNA levels. mRNA levels of CA2, 2b and 15a in larvae treated with 80 ppb EZA for 3 days was determined at 3 dpf. The mRNA levels were measured by quantitative real-time PCR using the comparative Ct method. β-Actin was used as an internal control for normalization. (D) Effects of EZA on otic neuromast. Hair cells of otic neuromasts labeled with YO-PRO-1 after exposure to various concentrations of EZA for 3 days were counted. (E, F) Location of CA in otic neuromast. Localization of CA2 in otic neuromasts of normal zebrafish at 5 dpf (E) and 1–5 dpf (F) visualized by immunohistochemical staining. Transverse sections of otocysts in non-treated (E, F) and MO-injected (E) larvae were stained with rabbit anti-CA antiserum. The values are expressed as arbitrary units and as percentages of the control. The data are means ± SD (n = 3). Asterisks indicate significant differences from the control (ANOVA followed by Dunnet’s test: *p < 0.05, **p < 0.01). |