
Figure 1
- ID
- ZDB-FIG-230102-26
- Publication
- Venditti et al., 2022 - A minimally invasive fin scratching protocol for fast genotyping and early selection of zebrafish embryos
- Other Figures
- All Figure Page
- Back to All Figure Page
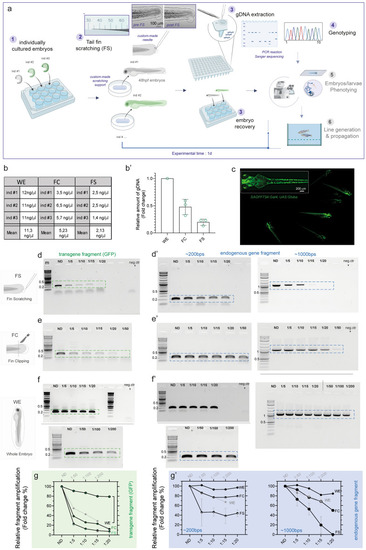
Caudal fin scratching protocol in 48 hpf zebrafish embryos allows sufficient genomic DNA extraction and genotyping. (a) Schematics of the general workflow to obtain genomic DNA (gDNA) from the tail fin scratching (FS) of individually cultured zebrafish embryos at 48 hpf. The single embryo are cultured in separated well plates (1); gentle tail fin scratching and tissue collection is performed on anesthetized embryos by using custom-pooled glass capillaries and a custom-made agarose-based support where fish are positioned (2); the tip of the capillary containing the collected tissue material is recovered and the samples are immediately processed to extract crude gDNA, while fish are recovered after the procedure (3); genotyping analyses are performed on the gDNA (4), while recovered embryos can immediately be used for morpho-functional phenotyping (5) and/or fish line generation and propagation (6). In step 2, a close-up of a representative custom-pooled needle with a reference scale. Insets on the right show representative bright field images of a single embryo before (pre-FS) and after (post-FS) the completion of the FS procedure. The extend of tissue removal after the procedure is shown in the dashed blue circle in post FS. (b, b′) Quantitative comparison of the yield of FS-, FC- and WE-derived gDNA from single embryos. Raw values from three different embryos (ind #) are shown in the table in b, the data are plotted as fold change relative to gDNA amount collected from WE-derived method in b’. The mean ± SEM from three individual embryos is shown. (c) Representative fluorescent image showing Tg(SAGFF73A:Gal4;UAS:Gtuba) embryos at 48 hpf, where green fluorescent protein (GFP) marks the ubiquitous expression of tubulin protein. A higher magnification on one of the embryos is shown in the inset on the top left. (d, d′) PCR results of fragment amplification of target GFP (d) and of endogenous gene fragment (d′) of approximately 200 bps (left) and 1000 bps (right) in length using non diluted (ND) or a series of dilutions of the original FS-derived gDNA from a single 48hpf embryo. (e–f′) PCR results of the same targets as in (d, d′) obtained by FC (e, e′) or by WE (f, f′) method from one single experiment. In each experiment a negative control (neg ctr) was added. One negative control was run for the PCR belonging to the same experiment (e and f or d′–f′ for 200 bps). Different gels in (f) are demarcated by a black line. For each procedure (FS, FC and WE), a comparative schematic is shown on the left. For FS, a representative PCR result is shown from three (d) and two (d′, left and right) independent experiments. For FC and WE, the single PCR performed is shown in (e, e′) left panel and (f) and (f′) left panel (200 bps band). A representative result from two independent experiments is shown in e’ and f’ right panel (1000 bps band). (g–g′) Plot showing the quantification and the relative amount of fragment amplification for GFP (g) and endogenous control gene fragments (g′) resulting from PCR reactions using different dilutions of the FS-, FC- and WE- derived single embryo gDNA. Values representing the relative quantification of the target amplicons from different dilutions derive from densitometric analysis of the PCR bands visible on agarose gel and are plotted as percentage changes compared to the WE-derived not diluted sample. FS data are expressed as mean ± SEM of the replicates as indicated above. m = molecular marker (Quick-Load® 1 kb Plus DNA Ladder, NEB #N0469S), the bands of 0.2, 0.5 and 1 kb are indicated. Source data are provided as a Source Data file. |