
Figure 4
- ID
- ZDB-FIG-221226-189
- Publication
- Silva et al., 2022 - Therapeutic Potential of Deflamin against Colorectal Cancer Development and Progression
- Other Figures
- All Figure Page
- Back to All Figure Page
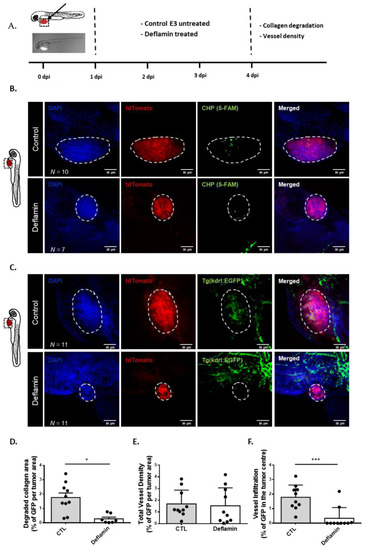
Cancer microenvironment analysis of HCT116 zebrafish xenotransplants: (A) Human cancer cell line HCT116 was stably transduced with FUdtTW plasmid (tdTomato expression marker) and injected into the perivitelline space (PVS) of 2 days post-fertilization (dpf) nacre/casper zebrafish larvae. Zebrafish xenografts were treated in vivo with deflamin for 72 h and compared with untreated controls regarding collagen degradation and vessel density; (B,C) At 4 days post-injection (dpi), zebrafish xenografts were imaged on PVS by confocal microscopy; (D) Quantification of degraded collagen area by analysis of CHP staining (5-FAM stained area); (E) Total vessel density analysis by EGFP marker; (F) Tumor vessel infiltration analysis by EGFP marker. The number of xenografts analyzed is indicated in the representative images. In the graphs, each dot represents one zebrafish xenograft. Statistical analysis was performed as described in the Statistical Analysis section (*, p ≤ 0.05; ***, p ≤ 0.001). Scale bars represent 50 μm. All images are anterior to the left, posterior to the right, dorsal up, and ventral down. |