
Figure 4
- ID
- ZDB-FIG-221226-11
- Publication
- Jia et al., 2022 - Horizontal Transfer and Evolutionary Profiles of Two Tc1/DD34E Transposons (ZB and SB) in Vertebrates
- Other Figures
- All Figure Page
- Back to All Figure Page
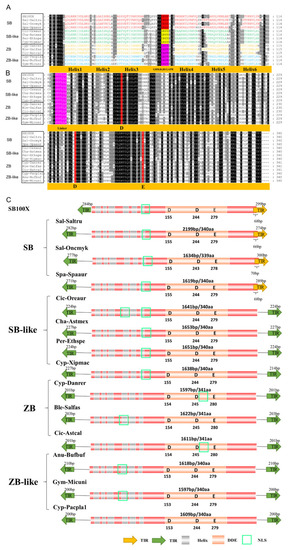
Structural organization of SB and ZB elements. (A) Alignment of the DBD domains of SB and ZB transposases. Representative species containing complete transposons were selected for each cluster. Sal-Saltru (Salmoniformes, Salmo trutta), Sal-Oncmyk (Salmoniformes, Oncorhynchus mykiss), Spa-Spaaur (Spariformes, Sparus aurata), Cic-Oreaur (Cichliformes, Oreochromis aureus), Cha-Astmex (Characiformes, Astyanax mexicanus), Per-Ethspe (Perciformes, Etheostoma spectabile), Cyp-Xipmac (Cyprinodontiformes, Xiphophorus maculatus), Cyp-Danrer (Cypriniformes, Danio rerio), Ble-Salfas (Blenniiformes, Salarias fasciatus), Cic-Astcal (Cichliformes, Astatotilapia calliptera), Cyp-Pacpla1 (Cyprinodontiformes, Pachypanchax playfairii), Anu-Bufbuf (Anura, Bufo bufo), and Gym-Micuni (Gymnophiona, Microcaecilia unicolor). Letters in different colors represent HTH patterns, and rectangles in different colors represent GRPR of different transposons. (B) Alignment of the DDE domains of SB and ZB transposases. The red rectangles represent the DDE domain, the pink rectangles represent linkers. (C) Structural organization of SB and ZB elements. Orange arrows and green arrows represent TIRs, and different colors represent different TIRs. The grey light column represents HTH motifs, the yellow circles represent NLS, the orange light column represents catalytic domains, and the red-light column represents transposons. |