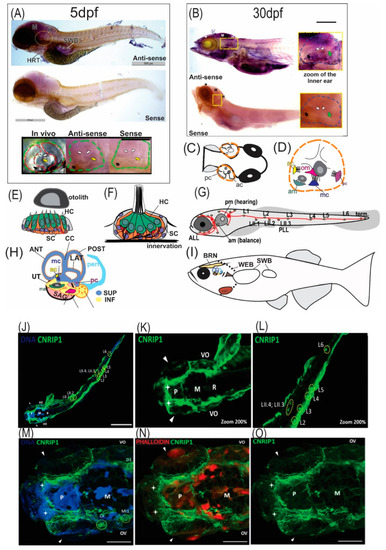
Expression and localization analysis of Cnrip1 in the zebrafish. In (A,B) zebrafish in situ hybridization results in a lateral section of specimens with 5 dpf and 30 dpf, respectively. The telencephalon and forebrain (*) and midbrain (M) and hindbrain (H) brain regions, and heart (HRT) are indicated. The area delimited in yellow dotted in the larger figure and zoomed in on the smaller figure, refers to the otic vesicle (OV) in (A) and IE in (B). In both figures, at zoom (5X magnification) the OV dotted in green is shown; in red, the semicircular canals; yellow arrow: posterior saccular otolith; black arrow: utricular anterior otolith; white arrows: position of the semicircular canals. Scale bar: 500 μm (5 dpf) and 100 μm (30 dpf). (C–I) Schematic representation of the auditory sensory organ of zebrafish in larval (OV) and adult (IE) stage 5, as well as line lateral (LL) and its neuromasts. (C) Dorsal view of the head region with eyes in black. The OV and the anterior (CA) and posterior (PC) canals are represented by the black outlines; dotted orange line: the medial wall of developing otocyst; gray: otoliths. (D) Representation of the OV of a larva and the epithelial structures around which the semicircular canals are formed. (E) Cross section of IE neuroepithelium (anterior macula): HCs in green, SCs in orange, and the apical part of the epithelium is bathed by endolymph. (F) Longitudinal diagram of a neuromast showing the different cell types that compose it, quite similar to the IE. (G) Schematic representation of a larva with the location of the anterior (ALL) and posterior (PLL) LL; orange/green: arrangement of neuromasts; red: ganglia that receive the innervations from the neuromasts of each LL. (H) Representation of the IE of adult zebrafish. (I) Side view of an adult zebrafish. The schematic representations in the figures were designed/drawn taking as models/references the illustrations from [9,53,54,55,56]. (J–L) Immunofluorescence of a zebrafish specimen (4 dpf) with anti-cnrip1 labeled in green and cell nucleus in blue (DAPI). (J) Top/front view of the full extent of the specimen. Scale bar: 500 μm. (K) Zoom (200 x) of the head region. Highlighted are the brain regions M, P, and R, the OV, and the olfactory bulb (white star). (L) Zoom (200 x) of the final portion of the tail, highlighting LLP and its neuromasts (yellow circles). (M–O) Superior dorsal view of the head. In red, we have the phalloidin labeling showing the actin filaments. White arrow: eyes. Scale bar: 100 μm. Images were analyzed with a Zeiss LSM 780 confocal microscope and captured with ZEN software. VO: otic vesicle; LL: lateral line; BRN: brain; WEB: Weber’s ossicles; IE: inner ear; SWB: swim bladder; HRT: heart; MA: anterior macula; LAG: Lagena; UT: utricle; SAC: saccule; SAG: statoacoustic ganglion; mc: medial crest; Cp: mc posterior crest; pm: posterior macula; ANT: anterior semicircular canal; POST: posterior semicircular canal; CC: central semicircular canal; LAT: lateral semicircular canal; SUP: upper pars; INF: lower pars.
|
