FIGURE

Fig. 2

ID
ZDB-FIG-221221-8
Publication
Markov et al., 2021 - A cerebellar internal model calibrates a feedback controller involved in sensorimotor control
Other Figures
All Figure Page
Back to All Figure Page
Fig. 2

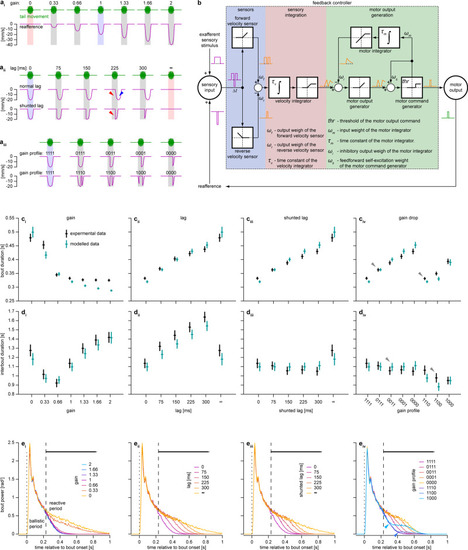
Acute reaction to unexpected perturbations in visual feedback can be implemented by a feedback controller.

a Reafference conditions used to induce acute reaction: gains (i), lags (ii), and gain drops (iii). Vertical shaded bars indicate swimming bouts, blue and red bars indicate normal reafference and open-loop conditions, respectively. Red triangles indicate insufficient reafference in the beginning of the bout, blue triangle indicates excessive reafference after the bout offset. Gain drop conditions (aiii) are labeled by four digits indicating the gain during the corresponding bout segments (e.g., condition 1100 has normal reafference during the first 150 ms of the bout but no reafference for the next 150 ms). b Feedback control model of acute reaction. White squares depict mathematical operations performed by respective nodes: integration, rectification, saturation, and thresholding. Magenta and green traces represent input and output of the model, orange traces represent output of respective nodes. Seven small Greek letters and 𝑡𝑟 denote eight parameters of the model; Δt denotes sensory processing delay of 220 ms. c, d Mean bout duration (c) and interbout duration (d) as a function of gain (i), lag (ii), shunted lag (iii) and gain drop profile (iv) for larvae (black) and the model (cyan). To obtain data for one larva, bout and interbout durations were averaged within each reafference condition. Mean ± SEM across larvae/models is shown; N = 100. Gray triangles in civ and div indicate two gain drop conditions, in which the gain was set to 0 during the same number of 75 ms segments of a bout but the behavior was modified differently depending on what bout segment had a perturbed reafference. e Bout power profile as a function of gain (i), lag (ii), shunted lag (iii) and gain drop profile (iv), averaged within each reafference condition in each larva. Median across larvae is shown. Dotted lines indicate bout onsets, dashed lines separate ballistic and reactive periods. Thick horizontal black lines above the plots indicate time points, at which bout power depends on reafference condition (Kruskal–Wallis test, p < 0.05/220, where 220 is the total number of tested time points). Blue triangles indicate that if perturbation in reafference was introduced after the bout had already started (as in gain drop conditions 1000 and 1100), the deviation in the respective mean bout power starts only around 220 ms after the start of the perturbation.

Expression Data

Expression Detail
Antibody Labeling
Phenotype Data

Phenotype Detail
Acknowledgments
This image is the copyrighted work of the attributed author or publisher, and ZFIN has permission only to display this image to its users. Additional permissions should be obtained from the applicable author or publisher of the image. Full text @ Nat. Commun.