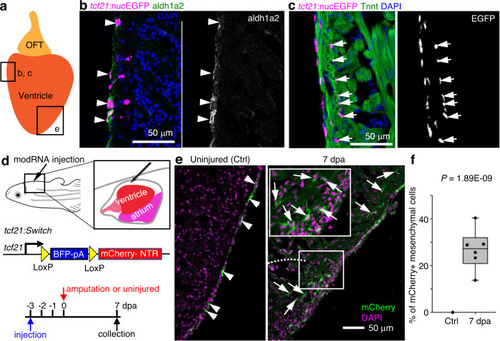
a Cartoon of an adult zebrafish heart showing the ventricle and outflow tract (OFT). The frames indicate representative regions for cryosection-section images in b, c and e. b A cryosection image of an uninjured heart showing tcf21:nucEGFP in magenta, antibody staining against aldh1a2 in green. Nuclei were stained with DAPI (blue). A single-channel image of aldh1a2 signals is shown in grayscale on the right. Arrowheads indicate EGFP+adh1a2+ cells. Scale bar, 50 μm. c A cryosection image of an uninjured heart showing tcf21:nucEGFP in magenta, antibody staining against Tnnt in green. Nuclei were stained with DAPI (blue). A single-channel image of EGFP is shown in grayscale on the right. Arrows indicate EGFP+ mesenchymal epicardial cells. Scale bar, 50 μm. d Schematic of experimental design for modRNA injection. e Section images of uninjured (left) and 7 dpa (right) hearts carrying the tcf21:Switch reporter at 10 days post Cre modRNA injection. Arrows and arrowheads indicate representative mCherry+ mesenchymal and epithelial cells, respectively. Scale bar, 50 μm. f Quantification of mCherry+ mesenchymal epicardial cells in the experiment of e. The largest cryosection of each heart was quantified for mCherry+ cells in the apex half of the ventricle. n = 13 (Ctrl) and 6 (7 dpa), respectively. Two-tailed Student’s t test. The box plot shows the median (center line), upper and lower quartiles (box limits), minimum and maximum values (whiskers), and individual values (points). Source data are provided as a Source data file.
|
