
FIGURE
Fig. 5
- ID
- ZDB-FIG-221203-9
- Publication
- Sander et al., 2021 - Approved drugs ezetimibe and disulfiram enhance mitochondrial Ca2+ uptake and suppress cardiac arrhythmogenesis
- Other Figures
- All Figure Page
- Back to All Figure Page
Fig. 5
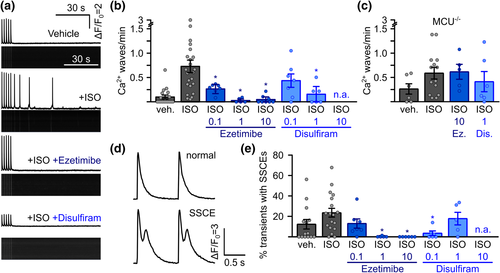
Suppression of arrhythmogenesis in freshly isolated murine RyR2C4496R/WT cardiomyocytes by ezetimibe and disulfiram. (a) Representative confocal linescan recordings of intracellular Ca2+ in freshly isolated ventricular cardiomyocytes from RyR2C4496R/WT mice. Cells were continuously pulsed at 0.5 Hz and spontaneous Ca2+ waves were analysed during 1.5 min after pulsing was stopped. Addition of isoprenaline (ISO) induced spontaneous Ca2+ waves which could be blocked by the addition of ezetimibe or disulfiram. (b) Quantitative analysis of the experiments in (a). Addition of ISO raised the propensity for spontaneous Ca2+ waves from 0.10 ± 0.04 waves per minute (n = 143 cells from 18 mice) to 0.73 ± 0.13 (n = 222 cells from 24 mice) in RyR2C4496R/WT mice. Addition of MiCups lowered waves to 0.27 ± 0.06 under 0.1 μM ezetimibe (n = 64 cells from seven mice), 0.032 ± 0.02 under 1 μM ezetimibe (n = 35 cells from five mice) and, finally, 0.05 ± 0.03 under 10 μM ezetimibe (n = 80 cells from eight mice) and to 0.44 ± 0.14 under 0.1 (n = 49 cells from seven mice) and 0.15 ± 0.08 under 1 (n = 35 cells from six mice) for disulfiram (Kruskal–Wallis test). (c) Disruption of mitochondrial Ca2+ uptake by genetic ablation of mitochondrial Ca2+ uniporter (MCU) in MCU−/− /RyR2C4496R/WT mice abolished the effect of ezetimibe (Ez) and disulfiram (Dis) indicated by comparable values of 0.61 ± 0.15 (n = 42 cells from five mice, P > 0.05 Kruskal–Wallis-test) for ISO + 10 μM ezetimibe and 0.39 ± 0.20 (n = 47 cells from six mice, P > 0.05, Kruskal–Wallis-test) for ISO + 1 μM disulfiram compared to 0.59 ± 0.12 (n = 107 from 14 mice) under ISO alone. (d) Representative recording from electrically induced systolic Ca2+ transients showing normal transients (upper trace) and transients with secondary systolic Ca2+ elevations (SSCEs). (e) SSCEs were observed in 12.4 ± 4.7% (n = 121 cells from 14 mice) of all transients in the vehicle control and rose to 23.3 ± 4.4% after addition of ISO (n = 134 cells from 18 mice). Addition of ezetimibe dose-dependently suppressed SSCEs to a minimum of 0.0% under 10 μM ezetimibe (n = 53 cells from six mice). Disulfiram decreased SSCEs to 3.4 ± 2.2% at 0.1 μM (n = 42 cells from six mice), while cells treated with 1 μM showed SSCEs in 17.5 ± 6.5% of all transients (n = 32 cells from five mice, Kruskal–Wallis test). n.a. = not analysable
|
Expression Data
Expression Detail
Antibody Labeling
Phenotype Data
Phenotype Detail
Acknowledgments
This image is the copyrighted work of the attributed author or publisher, and
ZFIN has permission only to display this image to its users.
Additional permissions should be obtained from the applicable author or publisher of the image.
Full text @ Br. J. Pharmacol.