
Fig. 1
- ID
- ZDB-FIG-221128-1
- Publication
- Liedtke et al., 2022 - Microarray expression profiling of fndc3a zebrafish mutants
- Other Figures
- All Figure Page
- Back to All Figure Page
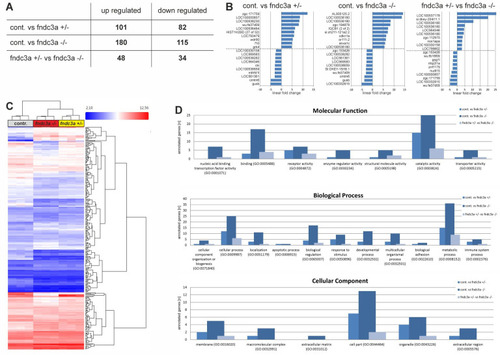
Figure 1. Analysis of microarray expression profiles of zebrafish fndc3a mutants at 26-somite stage: A) Number of up and down regulated transcripts in different genotype groups of fndc3a mutants. Comparison between different genotypes via Gene Level Differential Expression Analysis. B) Top 10 up- or downregulated transcripts in different genotype comparison groups. Given values are linear fold changes. C) Hierarchical clustering of transcripts comparing all nine experimental samples via Gene Level Differential Expression Analysis. Colors indicate fold changes, p value < 0.001. D) Panther GO term analyses of genotype comparison groups with focus of molecular function, biological processes and cellular components. Values imply number of up or down regulated genes for each condition and GO term (Go IDs; PANTHER 10.0 database). cont.: fndc3a+/+ wildtype embryos, AB strain; fndc3a +/-: fndc3awue1/+ heterozygous embryos; fndc3a -/-: fndc3awue1/wue1 homozygous embryos. |