
Fig. 3
- ID
- ZDB-FIG-221118-202
- Publication
- Bera et al., 2022 - Extracellular fluid viscosity enhances cell migration and cancer dissemination
- Other Figures
- All Figure Page
- Back to All Figure Page
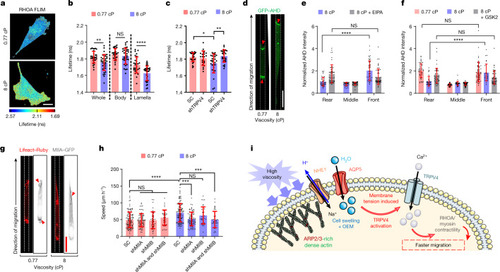
TRPV4-mediated activation of RHOA–ROCK–myosin II contractility.
a, The lifetimes of the RHOA activity biosensor in MDA-MB-231 cells on a 2D surface at the indicated viscosities. b, The subcellular distribution of RHOA activity in n ≥ 30 cells on a 2D surface from 4 experiments. c, RHOA activity in SC and shTRPV4 MDA-MB-231 cells (n ≥ 21) on a 2D surface from 3 experiments. d, Confocal images of GFP–AHD-expressing MDA-MB-231 cells in confinement. The red arrowheads indicate regions of active RHOA. e, GFP–AHD intensity in different segments of confined MDA-MB-231 cells (n ≥ 33) at 8 cP in the presence of vehicle control or NHE1 inhibitor from ≥3 experiments. f, GFP–AHD intensity in different segments of confined MDA-MB-231 cells (n ≥ 33) after treatment with vehicle control or the TRPV4 inhibitor GSK 2193874 (GSK2) from 3 experiments. The intensity in each segment was normalized to the mean intensity of the entire cell in e and f. g, Confocal images of MIIA–GFP-expressing and Lifeact–Ruby-expressing MDA-MB-231 cells migrating in confinement. The red arrowheads indicate regions of intense MIIA localization. h, The confined migration speeds of SC and MIIA and MIIB single- or double-knockdown MDA-MB-231 cells (n ≥ 38) from 2 experiments. Data are mean ± s.d. i, Schematic of the proposed viscosity-sensing pathway. OEM, osmotic engine model. The schematic in i was created using Servier Medical Art. Statistical analysis was performed using unpaired t-tests (b), Kruskal–Wallis tests followed by Dunn’s test (c and h) and two-way ANOVA followed by Tukey’s test (e and f). Scale bars, 20 µm (a, d and g). Source data |