
Figure 4.
- ID
- ZDB-FIG-221118-11
- Publication
- Hayot et al., 2022 - Loss of autism-candidate CHD8 perturbs neural crest development and intestinal homeostatic balance
- Other Figures
- All Figure Page
- Back to All Figure Page
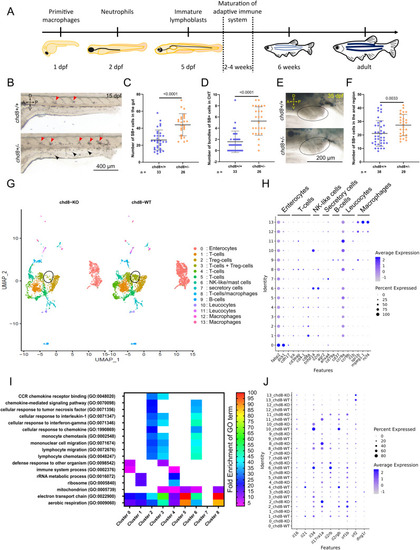
Altered immune balance in the absence of chd8. (A) Schematic showing the development of the zebrafish innate and adaptive immune system. (B) Representative lateral images of chd8+/+ and chd8sa19827/+ zebrafish larvae at 15 days post-fertilization, stained with Sudan Black (SB). Red arrowheads denote the presence of SB-positive bundles (i.e., >five SB-positive cells) in the caudal hematopoietic tissues, and black arrowheads denote the presence of SB-positive neutrophils. (C) Dot plot showing the number of SB-positive cells in the intestine for each condition tested. A t test was conducted between pairs of conditions. (D) Dot plot showing the number of bundles of SB-positive cells in the caudal hematopoietic tissues for each condition tested. A Mann–Whitney test was conducted between pairs of conditions. (E) Representative lateral images of the anal region, circled in black, of chd8+/+ and chd8sa19827/+ zebrafish juveniles at 35 days post-fertilization, stained with SB. Large SB-positive areas outside the anal region are lipids and are not quantified. (F) Dot plot showing the number of SB-positive cells in the anal region for each condition tested. A Mann–Whitney test was conducted between pairs of conditions. (G) UMAP of cells from whole mid- and posterior intestines from both adult homozygous chd8 mutants and controls, colored by cluster assignment. The black circle denotes foxp3a-positive Treg cells. (H) Cell-type signatures. The color of the dot shows the level of gene expression, and the size of the dot shows the percentage of cells per cluster that express the gene of interest. (I) Heatmap showing a subset of statistically significant GO terms, represented by at least 40 genes, identified using a PANTHER overrepresentation test (FDR = 0.05) for up-regulated genes in eight clusters. The colors represent the fold enrichment for each GO term. The full list of associated terms and P-values for each cluster is provided in Supplemental Data 2. (J) Dysregulation of immune-related genes. The color of the dot shows the level of the expression of genes of interest, and the size of the dot shows the percentage of cells per cluster that express the gene of interest. A, anterior; P, posterior; D, dorsal; V, ventral; and n, number of adult fish or juveniles. |
| Fish: | |
|---|---|
| Observed In: | |
| Stage Range: | Days 14-20 to Days 30-44 |