
FIGURE 3
- ID
- ZDB-FIG-221109-51
- Publication
- Xing et al., 2022 - Regulatory factor identification for nodal genes in zebrafish by causal inference
- Other Figures
- All Figure Page
- Back to All Figure Page
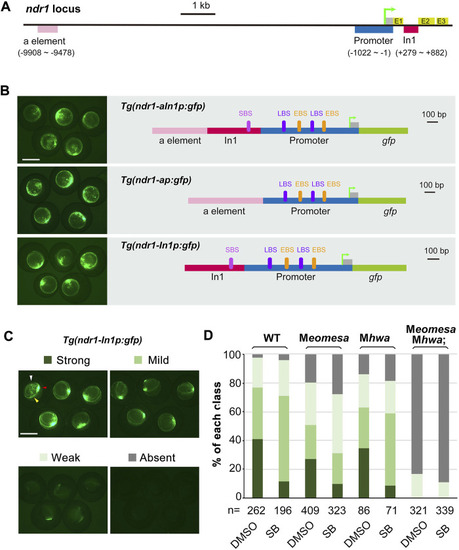
Regulation of ndr1 expression through transient transgenic assay. (A and B) Genomic organization of ndr1 locus (A) and composition of transgenes (B). The translation start site was designated as position +1. E, exons; In1, intron 1. EBS, Eomes-binding site; LBS, Lef/β-catenin binding site; SBS, Smad2-binding site. (C and D) Categorization of ndr1 transgenes in zebrafish embryos. Tg(ndr1-In1p:gfp) DNA was injected into one-cell stage WT or mutant embryos (50 pg/embryo), and GFP was observed at 4.3–5 hpf. For SB treatment, injected embryos were incubated in 50 μM SB or 1% DMSO (control) until observation. Based on GFP intensity in the blastodermal margin, embryos were categorized into four classes, as shown for WT embryos (top panel). The expression domain in the blastodermal margin is indicated by yellow heads, and the domain in the dorsal margin is indicated by red arrowheads in typical embryos. The presumably nonspecific signals are indicated by white arrowheads. Scale bars: 500 μm. The bar graphs (bottom) show the ratios of embryos in each class in WT or different mutants. n, the number of observed embryos. |