
FIGURE
FIGURE 2
- ID
- ZDB-FIG-221104-37
- Publication
- Dong et al., 2022 - Identification of key pharmacodynamic markers of American ginseng against heart failure based on metabolomics and zebrafish model
- Other Figures
- All Figure Page
- Back to All Figure Page
FIGURE 2
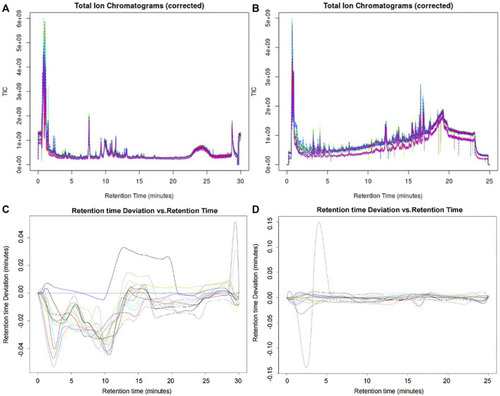
Superposition map of the total ion chromatograms of AG samples. |
Expression Data
Expression Detail
Antibody Labeling
Phenotype Data
Phenotype Detail
Acknowledgments
This image is the copyrighted work of the attributed author or publisher, and
ZFIN has permission only to display this image to its users.
Additional permissions should be obtained from the applicable author or publisher of the image.
Full text @ Front Pharmacol