FIGURE

Figure 6

ID
ZDB-FIG-221031-145
Publication
Farhan et al., 2022 - OpenBloodFlow: A User-Friendly OpenCV-Based Software Package for Blood Flow Velocity and Blood Cell Count Measurement for Fish Embryos
Other Figures
All Figure Page
Back to All Figure Page
Figure 6

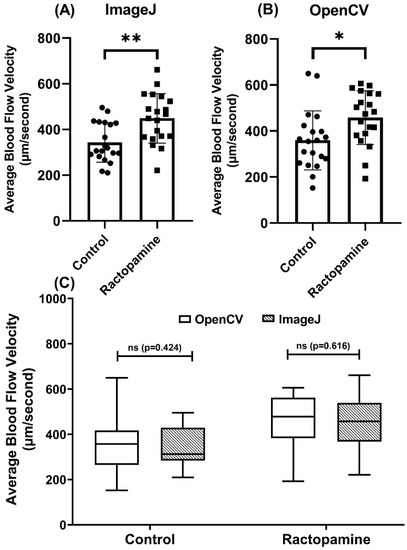
Validation of OpenBloodFlow performance for blood flow velocity measurement in zebrafish larvae through comparison with ImageJ method. Average blood flow velocity measured by ImageJ (A) and OpenBloodFlow (B) after exposure to ractopamine. Ractopamine exposure significantly elevated the average blood flow in zebrafish. (C) Side-by-side comparison of the average blood flow velocity measurement by ImageJ or OpenCV methods. The data were shown as mean with standard deviation and statistical significance determined by paired t-test for intra-group comparison (ns = no significance, * p < 0.05, ** p < 0.01, n = 20) (circle dots show the control data, while square dots show the ractopamine data in A and B).

Expression Data

Expression Detail
Antibody Labeling
Phenotype Data

Phenotype Detail
Acknowledgments
This image is the copyrighted work of the attributed author or publisher, and ZFIN has permission only to display this image to its users. Additional permissions should be obtained from the applicable author or publisher of the image. Full text @ Biology (Basel)