
Figure 4
- ID
- ZDB-FIG-221026-23
- Publication
- Toh et al., 2022 - Zebrafish neuromesodermal progenitors undergo a critical state transition in vivo
- Other Figures
- All Figure Page
- Back to All Figure Page
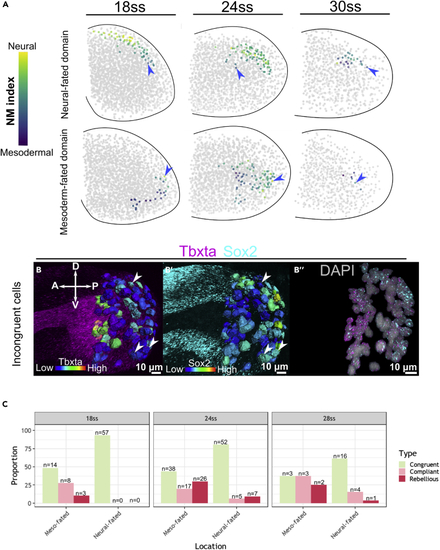
ZebReg’s composite maps reveal that the number of Rebellious cells peak at 24ss (A) Demarcation of the neural-fated and mesoderm-fated domains in the composite maps. Non-NMps are colored gray, whereas NMps are colored according to their NM index levels. Blue arrows mark incongruent cells. (B–B″) HCR stains of a representative zebrafish tailbud at 24ss for tbxta and sox2. Segmented surfaces correspond to NMps which are colored by the expression levels of tbxta (B) and sox2 (B′). Nuclear signals for sox2 and tbxta are shown to illustrate co-expression (B″). Arrow heads mark Incongruent cells. (C) Proportion of Congruent, Compliant and Rebellious cells in the mesoderm-fated and neural-fated domains at 18ss, 24 and 28ss. At each stage, summing up the number of Compliant and Rebellious cells yields the number of Incongruent cells. |