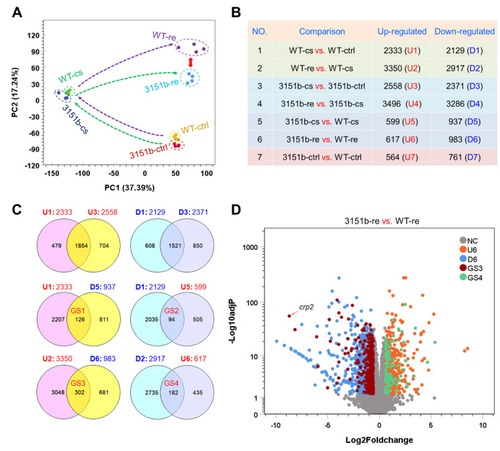
Effects of Tmem39b dysfunction on gene transcriptional expression of zebrafish larvae during cold exposure and rewarming. (A) Results of principal component analysis (PCA) illustrate the overall change in gene expression between different treatments and fish lines. The dashed arrows show the trajectory of gene expression alteration during cold exposure and rewarming. The red double-headed arrow demonstrates the augmented distance between the WT and zko3151b mutants during the recovery phase. (B) Numbers of the genes differentially expressed between different treatments and fish lines. The up- and down-regulated gene sets (U and D) are numbered sequentially according to the comparisons. (C) Venn diagrams demonstrate the number of genes affected by tmem39b mutation under different circumstances. (D) A volcano plot indicates the genes affected by Tmem39b deficiency during rewarming. Representative genes induced by rewarming and negatively affected by tmem39b mutation are shown. NC, not changed; U6 and D6, the same as in (B); GS3 and GS4, the same as in (C).
|
