
Fig. 7
- ID
- ZDB-FIG-221017-28
- Publication
- Pandey et al., 2021 - Multiplexed bio-imaging using cadmium telluride quantum dots synthesized by mathematically derived process parameters in a continuous flow active microreactor
- Other Figures
- All Figure Page
- Back to All Figure Page
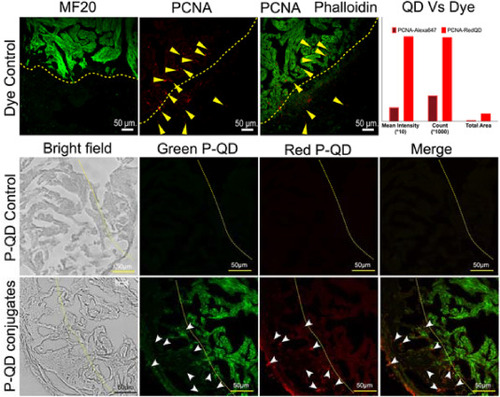
Fig. 7. Confocal images of sagittal cardiac sections showing cardiomyocytes and proliferating cells in wild-type zebrafish cardiac tissue. The dye control panel shows Alexa Fluor 488-phalloidin and Alexa Fluor 647-phalloidin conjugated with primary antibodies of MF20 and PCNA, respectively. The overlay image shows Alexa Fluor 555 Phalloidin (Green) and Alexa Fluor 647-phalloidin conjugated with PCNA primary antibody. A comparison of fluorescence intensities of QDs and dyes analyzed using ImageJ software is shown as a bar chart. PQDs control panel represents confocal images stained with unconjugated green and red P-QDs as a negative control. Green P-QDs conjugated MF20, and red P-QDs conjugated PCNA recognize cardiomyocytes and nuclei undergoing DNA synthesis. Arrowheads point to the proliferating cells in the injury region (for dye control and QDs). The yellow dotted line (for dye control and QDs) demarcates the healthy cardiac tissue from the cryo-injured region. The images with the dye were captured after 4 dpci, whereas those with QDs were imaged after 7 dpci. Scale bar: 50 μm; Magnification: 63×. |