
Fig. 1
- ID
- ZDB-FIG-221004-10
- Publication
- Ncube et al., 2022 - A conserved transcriptional fingerprint of multi-neurotransmitter neurons necessary for social behavior
- Other Figures
- All Figure Page
- Back to All Figure Page
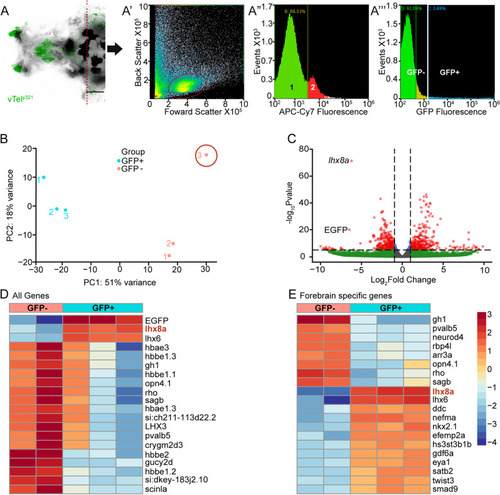
vTely321 transcriptome confirms its transgenic origin. A Dorsal view of vTely321 transgene expression in the forebrain and the dissection plane (dotted red line) for dissociation. Overlay of fluorescence (green) and transmitted light (greyscale). Scale bar = 100 μm. A’ FACS isolation of cell cluster (circled) after dissociation. A” Graph shows cutoff between live (1, green) (88.33%), and dead (2, red) cells (11.67%). A”’ Proportions of GFP positive (cyan, 3.69%) and negative cells (green, 92.09%) from the live cell fraction. B Principal component analysis of GFP positive and negative samples after variance stabilization transformation of gene count data. Sample 3 in the GFP negative fraction was dropped from subsequent analysis as an outlier. C Volcano plot of the ~ 23,000 genes expressed in the samples. Gray: Not significantly enriched and/or no fold change; Blue: significant differential expression (p < 0.05) but with fold change below threshold; Green: Up or downregulated (positive or negative fold change) without significant differential expression; Red: Significantly differentially regulated. D Heatmap of the 20 genes with the greatest differential expression between GFP positive and GFP negative samples. E Heatmap of the 20 forebrain specific genes with the greatest differential expression between GFP positive and GFP negative samples |