
Fig. 9
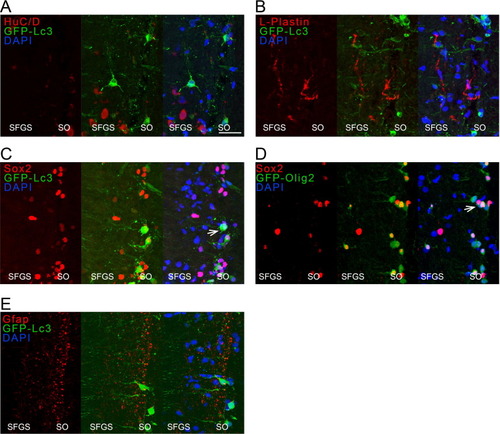
Fig. 9. Immunostaining for HuC/D, L-plastin, Gfap and Sox2 on optic tectum cryosections of Tg(CMV:GFP-Lc3) autophagy reporter fish and for Sox2 on sections of Tg(olig2-GFP), all tissues harvested at three days after optic nerve injury. (A, B) No overlap between the pan-neuronal HuC/D or pan-leukocyte marker L-plastin (both in red) could be detected with the Lc3+ cells (green). (C) The cells with elevated autophagy levels (green) did co-label with the Sox2 pluripotency marker (red, one marked with an arrow). (D) The Sox2+ cells (red) were often also positive for olig2 (green, one indicated with an arrow), visualizing oligodendrocyte precursor cells or oligodendrocytes. (E) Finally, Gfap (red) was mainly present there where the Lc3+ cells (green) were located, but no overlap is visible. Scale bar = 25 µm. Representative images of n = 4. Dpi, days post-injury; Gfap, glial fibrillary acid protein; GFP, green fluorescent protein; Hu, Hu proteins; Lc3, microtubule-associated protein 1A/1B-light chain 3; ONC, optic nerve crush; SFGS, stratum fibrosum et griseum superficiale; SO, stratum opticum; Sox2, sex determining region Y-box2. (For interpretation of the references to colour in this figure legend, the reader is referred to the web version of this article.) |