
FIGURE
Fig. 3
- ID
- ZDB-FIG-220926-44
- Publication
- Zhao et al., 2022 - Comparative Transcriptome Analysis Provides Novel Molecular Events for the Differentiation and Maturation of Hepatocytes during the Liver Development of Zebrafish
- Other Figures
- All Figure Page
- Back to All Figure Page
Fig. 3
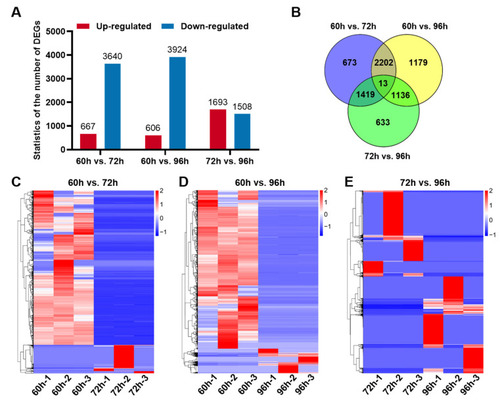
The differentially expressed genes analysis in early liver developmental stages. (A) Statistics of differentially expressed genes (DEGs) in hepatocytes between two time points. (B) The Venn diagram analysis of DEGs in hepatocytes among three time points. Heatmaps of DEGs between two time points, including 60 and 72 hpf (C), 60 and 96 hpf (D), as well as 72 and 96 hpf (E). |
Expression Data
Expression Detail
Antibody Labeling
Phenotype Data
Phenotype Detail
Acknowledgments
This image is the copyrighted work of the attributed author or publisher, and
ZFIN has permission only to display this image to its users.
Additional permissions should be obtained from the applicable author or publisher of the image.
Full text @ Biomedicines