
FIGURE
Figure 5
- ID
- ZDB-FIG-220920-31
- Publication
- Meyer-Miner et al., 2022 - Resolving primary pathomechanisms driving idiopathic-like spinal curvature using a new katnb1 scoliosis model
- Other Figures
- All Figure Page
- Back to All Figure Page
Figure 5
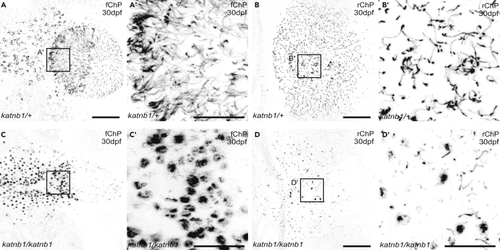
(A–D) Representative maximum intensity Z-stack projections of confocal micrographs, acquired through dorsally oriented whole mount brains that were dissected from 30 dpf |
Expression Data
Expression Detail
Antibody Labeling
Phenotype Data
| Fish: | |
|---|---|
| Observed In: | |
| Stage: | Days 30-44 |
Phenotype Detail
Acknowledgments
This image is the copyrighted work of the attributed author or publisher, and
ZFIN has permission only to display this image to its users.
Additional permissions should be obtained from the applicable author or publisher of the image.
Full text @ iScience