
FIGURE
Figure 6.
- ID
- ZDB-FIG-220912-72
- Publication
- Suryadi et al., 2022 - Dynamics and potential significance of spontaneous activity in the habenula
- Other Figures
- All Figure Page
- Back to All Figure Page
Figure 6.
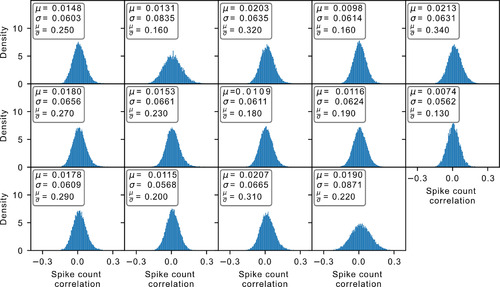
Spike count correlation distribution. Each panel indicates the distribution of a different dataset. For all the accepted datasets, the mean |
Expression Data
Expression Detail
Antibody Labeling
Phenotype Data
Phenotype Detail
Acknowledgments
This image is the copyrighted work of the attributed author or publisher, and
ZFIN has permission only to display this image to its users.
Additional permissions should be obtained from the applicable author or publisher of the image.
Full text @ eNeuro