|
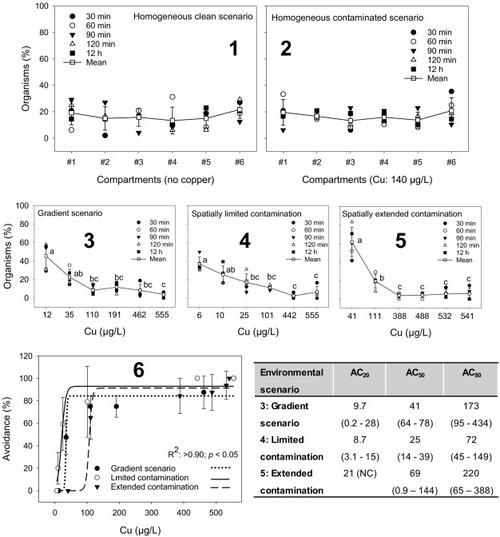
Spatial distribution (%) at different time periods (30, 60, 90 and 120 min and 12 h and a mean of all the exposure times) of fish populations in the multi-compartmented exposure system in tests with five different scenarios: homogenously clean scenario (1), homogeneously contaminated scenario (2), contamination gradient scenario (3), spatially limited contamination scenario (4) and spatially extended contamination scenario (5). Different letters indicate statistically significant differences in the mean values (Bonferroni post-hoc test; p < 0.05). The mean (for 12 h exposure) avoidance (%) and sigmoidal models for the three heterogeneous contamination scenarios are also presented. The table presents the values of AC20, AC50 and AC80 (μg/L) of copper for zebrafish exposed for 12 h to the three heterogeneous copper contamination scenarios. NC: not calculated.
|