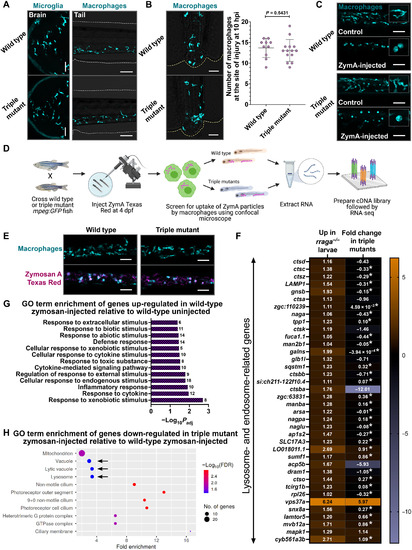
(A) Microglia and macrophages visualized using the mpeg:GFP transgene in wild-type animals and tfeb; tfe3a; tfe3b triple mutants at 4 dpf. Macrophage response to (B) tail injury and (C) systemic ZymA injection in wild-type and triple mutant animals at 4 dpf. hpi, hours post-injury. Insets in (C) show magnified views of macrophage morphology. Graph in (B) shows mean + SD; significance was determined using parametric unpaired t test. The number of animals analyzed for each experiment is listed in table S1; all the panels are representative of at least two independent experiments. (D) Experimental schematic for RNA-seq. (E) Microscopy-based validation of ZymA Texas Red uptake by the trunk and tail macrophages in triple mutants and wild-type animals at 4 dpf before RNA-seq. Approximately 20 larvae of each genotype were used for RNA extraction per biological replicate; three biological replicates were used for RNA-seq. (F) Heatmap depicting all the lysosomal genes significantly up-regulated (log2 fold change > +1, Padj < 0.05) in rraga mutant whole larvae and the corresponding fold change of the gene in triple mutant larval RNA preparations. The log2 fold change is shown in each cell; fold change values with asterisks are not significant (Padj > 0.05). (G) GO term enrichment analysis of genes differentially up-regulated in wild-type ZymA-injected animals relative to uninjected wild-type controls. (H) GO term enrichment of genes significantly down-regulated in ZymA-injected triple mutants. FDR, false discovery rate.