
FIGURE
Fig. 10
Fig. 10
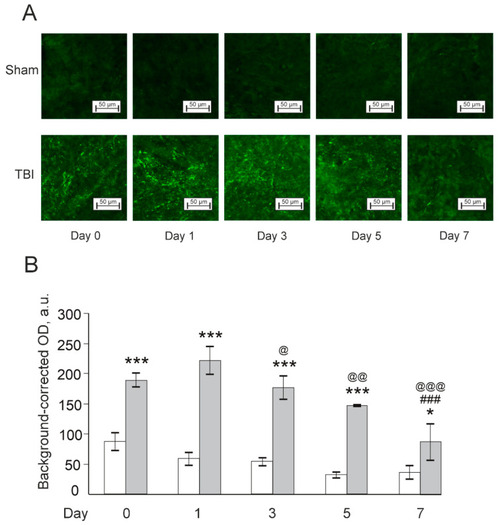
Effects of laser-induced lesion (TBI model) on the expression of microglial marker Iba1 in zebrafish telencephalon on Day 0 (30 min after the lesion), Days 1, 3, 5, and 7 after the injury. (A): Representative images of Iba1 immunoreactivity in the telencephalon; magnification, ×200. (B): Quantitative results. White bars represent Sham groups, grey bars TBI groups. Data are expressed as mean ± SEM (n = 3–4 per group). * p < 0.05, *** p < 0.001 vs. Sham group on the same day after the injury; ### p < 0.001 vs. TBI group on Day 0; @ p < 0.05, @@ p < 0.01, @@@ p < 0.001 vs. TBI group on Day 1. |
Expression Data
| Antibody: | |
|---|---|
| Fish: | |
| Condition: | |
| Anatomical Term: | |
| Stage: | Adult |
Expression Detail
Antibody Labeling
Phenotype Data
| Fish: | |
|---|---|
| Condition: | |
| Observed In: | |
| Stage: | Adult |
Phenotype Detail
Acknowledgments
This image is the copyrighted work of the attributed author or publisher, and
ZFIN has permission only to display this image to its users.
Additional permissions should be obtained from the applicable author or publisher of the image.
Full text @ Pharmaceutics