
Fig. 4
- ID
- ZDB-FIG-220822-12
- Publication
- DeMarco et al., 2022 - A genetic labeling system to study dendritic spine development in zebrafish models of neurodevelopmental disorders
- Other Figures
- All Figure Page
- Back to All Figure Page
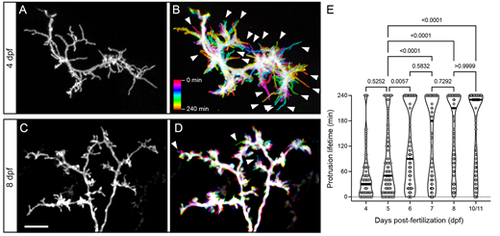
Developmental changes in protrusion stability. (A) High magnification view of the SM-targeted apical dendrite of a 4 dpf PyrN. Note the abundance of long, filopodial protrusions. (B) Temporal color-coded image of the dendrite in A during a 4 h time-lapse recording with image stacks acquired every 10 min. The color scale indicates which image corresponds to each timepoint. Note the prevalence of motile protrusions with a single-color label, indicating that they were present at that position during a single acquisition (arrowheads). (C) High magnification view of the SM-targeted apical dendrite of an 8 dpf PyrN. Note the abundance of short, spine-like protrusions. (D) Temporal color-coded image of the dendrite in C during a 4 h time-lapse recording with image volumes acquired every 10 min. Note the relatively small number of filopodia-like motile protrusions generated (arrowheads). (E) Comparison of protrusion lifetimes at 4, 5, 6, 7, 8 and 10/11 dpf. Note the gradual increase in stable protrusions (240 min lifetimes) and decrease in transient spines lasting less than 120 min. The horizontal lines on the violin plots indicate median values for each group. One-way ANOVA with Tukey's multiple comparisons test was used to determine significance. Significant differences not shown on graph: 4 dpf versus 6 dpf, P<0.0001; 4 dpf versus 7 dpf, P<0.0001; 4 dpf versus 8 dpf, P<0.0001; 4 dpf versus 10/11 dpf, P<0.0001; 6 dpf versus 8 dpf, P=0.015; and 6 dpf versus 10/11 dpf, P=0.0154. Number of spines and neurons (indicated in parentheses) analyzed at each timepoint: 73 (4), 91 (5), 99 (4), 83 (4), 123 (4) and 110 (4). Scale bar: 5 µm. |