
Fig. 3
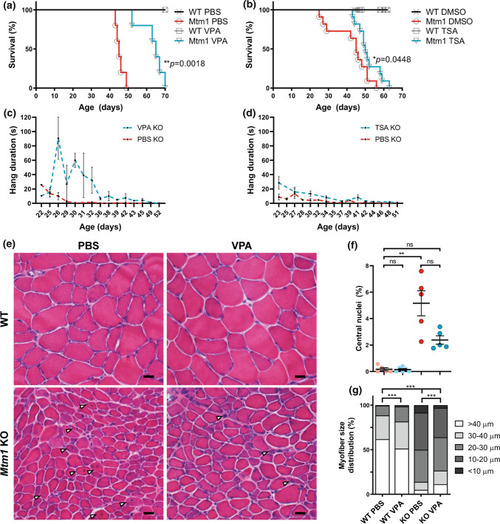
HDAC inhibitors improve phenotypic outcomes in Mtm1 KO mice. a, b Valproic acid (VPA) treatment starting at 21 days promotes significant improvement in Mtm1 KO survival [median survival 65 days (n = 5) vs. 45 days for Mtm1 KOs + PBS (n = 5), **p < 0.01]. VPA improves strength as measured by wire hang duration (n = 2–4 per timepoint; best-fit curves by least squares regression are different, p = 0.0002). c, d Trichostatin A (TSA) has a measurable, yet much less positive, effect on KO mice. TSA treatment starting at 21 days promotes significant improvement in Mtm1 KO survival [median survival 50 days (n = 10) vs. 45 days for Mtm1 KOs + DMSO (n = 11), *p < 0.05]. TSA improves strength as measured by wire hang duration (n = 2–11 per timepoint; best-fit curves by least squares regression are different, p < 0.001). e, f Tibialis anterior muscle cross-sections at 35 days stained with haematoxylin and eosin (scale bar = 20 µm). VPA treatment is associated with a reduction in number of centrally nucleated fibres that is not significant. From left to right, Mean % central nuclei ± SEM are 0.17 ± 0.11%, 0.15 ± 0.07%, 5.20 ± 0.95%, 2.40 ± 0.32%; n = 1836, 2069, 6983, 6167 total fibres counted across 6–10 different fields from n = 5 to 6 animals; Kruskal–Wallis test with Dunn’s post-test; **p < 0.01. g VPA treatment significantly improves myofiber diameter size in Mtm1 KO mice as measured by minimum Feret’s diameter. From left to right, Mean Feret’s diameter ± S.E.M are: 45.54 ± 0.388, 42.16 ± 0.332, 21.39 ± 0.185, 25.39 ± 0.224, respectively. From left to right, % myofiber size distribution for < 10 μm/10–20 μm/20–30 μm/30–40 μm/ > 40 μm bins are: 0/0.497/11.019/26.678/61.806; 0.0633/1.456/16.835/30.380/51.266; 8.358/41.605/36.119/8.873/5.044; 3.033/33.037/37.323/15.326/11.282; n = 1207, 1580, 2716, 2473 total fibers measured across three different sections from n = 5–6 animals; Kruskal–Wallis test with Dunn’s post-test; ***p < 0.001 |