
Fig. 4
- ID
- ZDB-FIG-220817-30
- Publication
- Braems et al., 2022 - HNRNPK alleviates RNA toxicity by counteracting DNA damage in C9orf72 ALS
- Other Figures
- All Figure Page
- Back to All Figure Page
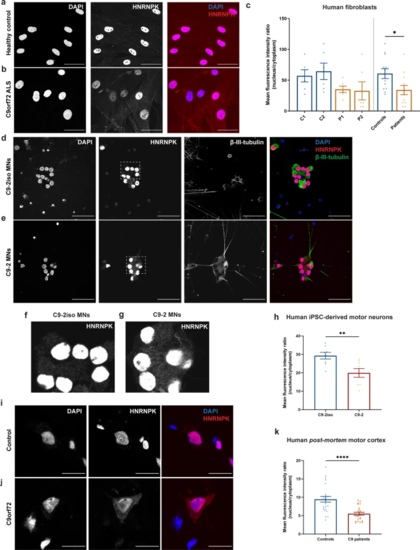
HNRNPK is mislocalized to the cytoplasm in C9orf72 ALS patient fibroblasts, iPSC-derived motor neurons and ALS patient post-mortem motor cortex. a, b Immunofluorescence of fibroblasts derived from a non-neurodegenerative control and a C9orf72 ALS patient showing localization of HNRNPK. Scale bar = 50 µm. c Quantification of nuclear and cytoplasmic HNRNPK protein levels measured as mean fluorescence intensity ratio (N = 3 experiments, 2 technical replicates). Two control fibroblast lines (C1, C2) and two patient lines (P1, P2) were quantified. Pooled control and patient data is indicated on the right side of the dotted line. d, e Immunofluorescence of mature (38 days) motor neurons derived from iPSCs from a non-neurodegenerative control and a C9orf72 ALS patient showing localization of HNRNPK. β-III-tubulin was used as a neuronal marker. Scale bar = 50 µm. f, g Close-up images from (d) and (e) showing increased cytoplasmic localization of HNRNPK in C9-2 patient line (g) compared to its isogenic control (f). h Quantification of nuclear and cytoplasmic HNRNPK protein levels measured as mean fluorescence intensity ratio (N = 4 experiments, 2 technical replicates). One patient line (C9-2) and its corresponding isogenic line (C9-2iso) were quantified. i–k Immunofluorescence of post-mortem motor cortex from a non-neurodegenerative control and a C9orf72 ALS patient showing localization of HNRNPK. Scale bar = 20 µm. k Quantification of nuclear and cytoplasmic HNRNPK protein levels measured as mean fluorescence intensity ratio in 4 non-neurodegenerative controls and 4 C9 ALS/FTD patients (N = 3 experiments, 2 technical replicates). c, h, k Data represent mean ± SEM. Statistical significance was evaluated with unpaired t test; *P < 0.05, **P < 0.01, ****P < 0.0001. Each data point represents the average N/C ratio per replicate. In total, 10 images were analyzed per experiment and per patient line or sample |