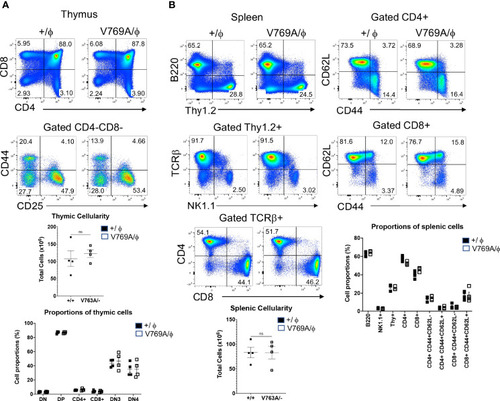
Phenotypic analysis of lymphoid development in Med14 mutant mice. (A) Histograms are displayed of flow cytometry analysis of thymic cell suspensions from wildtype (+/ϕ) and hemizygous Med14 mutant (V769A/ϕ) mice. The following antibodies were used: CD4, CD8, CD44, and CD25. Scatter plots of total thymic cellularity and the frequencies of the indicated populations are depicted. The following populations are graphed: DN, CD4-CD8-; DP, CD4+CD8+; CD4+; CD8+; DN3, CD4-CD8-CD44-CD25+; DN4, CD4-CD8-CD44-CD25-. Proportion of DN3 and DN4 subpopulations among DN thymocytes is depicted graphically (B) Histograms are displayed that illustrate flow cytometric analysis of the lymphoid content of spleens from +/ϕ and V769A/ϕ mice. The following antibodies were used: B220, Thy1.2, NK1.1, CD4, CD8, TCRβ, CD44, and CD62L. Scatter plots of total splenic cellularity and the frequencies of the indicated populations are depicted. Each symbol represents an individual mouse. The proportions of CD4 and CD8 T cells among Thy1+ cells and the proportions of memory subsets among CD4+ and CD8+ subsets are depicted graphically. Data are representative of 3 experiments performed. No statistically significant differences were found in any of the indicated populations.
|
