|
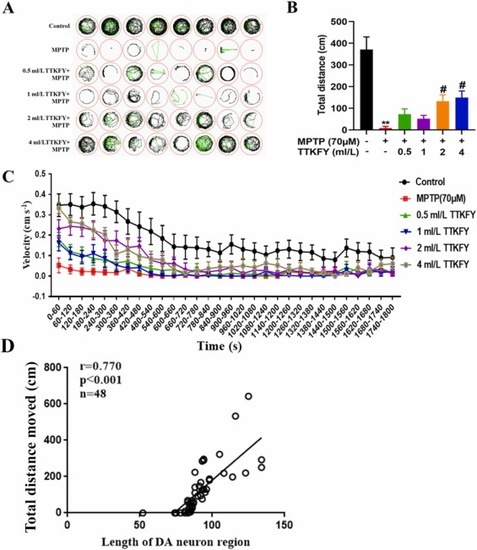
Fig. 4. Neuroprotective effect of TTKFY on MPTP-induced locomotion impairments in zebrafish. (A) The digital track map. Red, green, and black lines represent fast, medium, and slow movement trajectories, respectively. n = 8 per group. (B) The total distance moved in control, MPTP, and MPTP + TTKFY groups. n = 8 per group. (C) Average movement speed of larvae for different treatment groups. n = 8 per group. Average speed in every 60 s was calculated. TTKFY – Tongtian oral liquid. **P < 0.01, compared with the MPTP treatment group, #P < 0.05. (D) Pearson’s Correlation Coefficient analysis reveals the positive correlation between locomotor dysfunction and the percentage of decrease of DAnergic neurons. Correlation is significant at the level of P < 0.001.
|