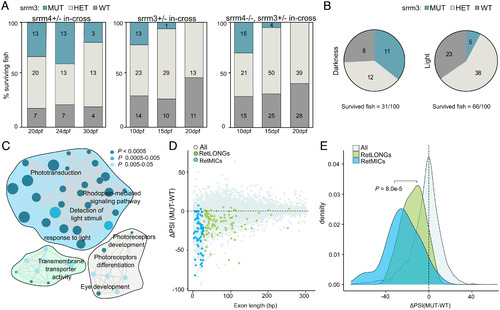
srrm3 depletion in zebrafish causes early lethality and RetMIC down-regulation. (A) Genotype distribution for surviving larvae at different time points from in-crosses of srrm4+/−, srrm3+/−, or srrm4−/−;srrm3+/− (double mutants) fish. (B) Genotype distribution for surviving larvae at 13 dpf from a srrm3+/− in-cross in dark and control light conditions. For both A and B, the number of animals per genotype and time-point is indicated in the plots. (C) Enriched biological process GO terms for genes down-regulated in srrm3 homozygous mutants (MUT) eyes at 5 dpf [log2FC(MUT/WT) ≤ −1.5]. GO terms are grouped by ClueGO into three networks according to their GO groups. GO groups are highlighted using three different arbitrary colors, as listed in Dataset S9. P values are corrected with Bonferroni step down. (D) Change in inclusion levels [ΔPSI (MUT-WT)] quantified using vast-tools for all exons shorter than 300 bp with sufficient read coverage in WT and srrm3 MUT eyes at 5 dpf. Blue/green dots correspond to RetMICs and RetLONGs, respectively. (E) Density plots for ΔPSI distributions of RetMICs, RetLONGs, and other alternative exons (10 < PSI < 90 in WT and MUT at 5 dpf) (P = 8.0e-5; Wilcoxon rank-sum test).
|
