
Fig. 1
- ID
- ZDB-FIG-220701-25
- Publication
- Kenny et al., 2022 - TFAP2 paralogs facilitate chromatin access for MITF at pigmentation and cell proliferation genes
- Other Figures
- All Figure Page
- Back to All Figure Page
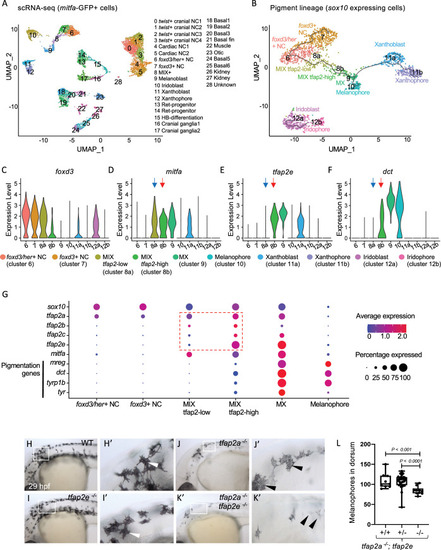
Expression of tfap2 paralogs in the melanophore lineage precedes activation of Mitfa-target genes in-vivo.
(A) Uniform Manifold Approximation and Projection (UMAP) obtained after clustering (dimensions, dims = 30, resolution = 1.2) GFP+ cells (n = 11,217 cells) sorted from Tg(mitfa:GFP) zebrafish embryos at 28 hours post fertilization (hpf). Annotated cell clusters as labelled. (B) UMAP obtained after re-clustering sox10-expressing clusters 6–12 (n = 1918 cells). Black line—Monocle pseudotime trajectory analysis starting at foxd3+ neural crest cells showing the progression through different pigment cell clusters as shown. (C-F) Violin plots showing expression of select genes foxd3, mitfa, tfap2e and dct for each cell cluster represented in B. Blue arrows point to the MIX-tfap2-low cluster, and show that mitfa, but not pigmentation genes, are expressed in this cluster (tfap2a is also expressed in this cluster). Red arrows point to the MIX-tfap2-high cluster, and show that mitfa, tfap2e, and pigmentation genes are expressed in this cluster. (G) Dot plot representing the expression of sox10, tfap2 paralogs, mitfa and Mitfa-target genes, and the percentage of cells expressing these genes in neural crest, MIX, MX and melanophore clusters. Expression of tfap2 paralogs are highlighted in MIX tfap2-low and MIX tfap2-high clusters (red box). Size of dots represents percentage of cells expressing the gene, and blue-red scale (low-high) represents relative average expression among cells. (H-K) Lateral views of head and trunk of live embryos at 29 hpf, anterior to the left and dorsal to the top. Genotype as shown. Boxes, regions magnified in accompanying panels H’-K.’ (H-H’) A wild-type or heterozygous mutant (sibling) embryo with normal melanophores (white arrowheads). (I-I’) A tfap2eui157/ui157 embryo, with melanophores that are normal in terms of number, differentiation and pigmentation (white arrowheads). (J-J’) A tfap2alow/low homozygous mutant embryo, with fewer melanophores than tfap2eui157ui/157 and WT sibling embryos. (K-K’) A tfap2alow/low; tfap2e ui157ui/157 double-mutant embryo, with fewer and paler melanophores than in tfap2alow/low siblings. (L) Box plot illustrating the number of pigmented melanophores in the dorsum of tfap2alow/low, tfap2alow/low; tfap2e+/ ui157, and tfap2alow/low; tfap2eui157/ui157 double mutant embryos at 36 hpf. Center line, mean; box limits, upper and lower quartiles; whiskers, minimum and maximum values; black dots, number of melanocytes per individual embryo (tfap2alow/low; n = 9, tfap2alow/low; tfap2e+/ui157; n = 32, tfap2alow/low; tfap2eui157/ui157, n = 10). P-value according to the Student’s t-test. |