
Fig. 2
- ID
- ZDB-FIG-220701-2
- Publication
- Nag et al., 2022 - An adult zebrafish model for adherent-invasive Escherichia coli indicates protection from AIEC infection by probiotic E. coli Nissle
- Other Figures
- All Figure Page
- Back to All Figure Page
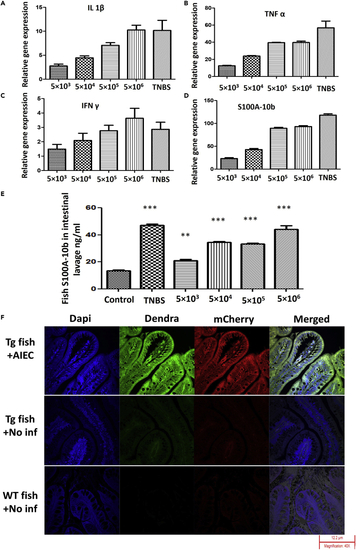
Inflammation induced by AIEC in zebrafish (A–D) WT zebrafish were infected with AIEC at 5×10³, 5×10⁴, 5×10⁵, or 5 × 10⁶ CFU/mL for 6 h, moved to fresh water for 18 h, and then sacrificed. mRNA was isolated from intestinal tissue. Relative gene expression levels of TNFα (A), s100a-10b (B), IFNγ (C), and IL-1β (D) were determined by qRT-PCR. Gene expression was normalized against β-actin and expressed as fold change. TNBS, a positive stimulator of inflammatory markers, was used as a positive control. Error bars indicate standard deviation. Data are represented as mean +/− SEM from three experiments. (E) S100A-10b (calprotectin) protein levels were determined in intestinal homogenate via ELISA. Error bars indicate standard deviation. TNBS, a positive stimulator of inflammatory markers, was used as a positive control. Data are represented as mean +/− SEM from three experiments. ∗∗p < 0.005 and ∗∗∗p < 0.0005 as compared with control. (F) Fluorescent microscopy of neutrophil response to AIEC infection of transgenic (mpx:dendra) zebrafish intestinal epithelium. Fish were exposed to 5 × 10⁶ CFU/mL of AIEC for 6 h, moved to fresh water for 18 h, then sacrificed, fixed, and prepared for sectioning. Bacteria were visualized (Red) by expressing mCherry from the pPrps plasmid; blue fluorescence (DAPI) represents intestinal epithelial cell nuclei (bottom row: no DAPI staining and the merged figure contains white background), and green fluorescence (Dendra) represents neutrophils. Magnification 40X. The fluorescent figures are representative of three independent experiments. |