
Fig. 3
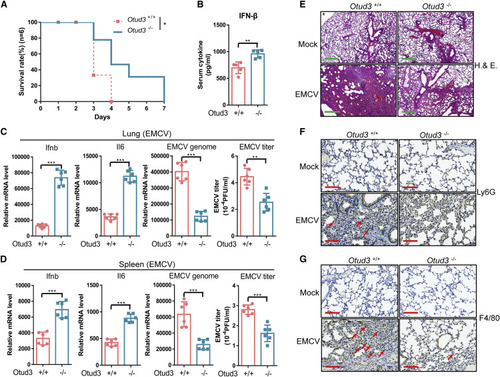
Figure 3. OTUD3-deficient mice are more resistant to EMCV infection (A) Survival (Kaplan-Meier curve) of Otud3+/+ and Otud−/− mice (n = 6 per group) at various times after intraperitoneal (i.p.) injection with EMCV (1 × 10⁶ plaque-forming units [PFU] per mouse). (B) ELISA of IFN-β in serum from Otud3+/+ and Otud3−/− mice (n = 5 per group) given i.p. injection of EMCV (1 × 10⁶ PFU per mouse) for 12 h. (C and D) qRT-PCR analysis of Ifnb, IL6, EMCV mRNA, and plaque assays for EMCV titers in the lungs (C) and spleens (D) from Otud3+/+ and Otud3−/− mice given i.p. injection of EMCV (1 × 10⁶ PFU per mouse) for 24 h. (E–G) Microscopy of H&E-stained (E), Ly6G-stained (F), or F480-stained lung sections from Otud3+/+ and Otud3−/− mice treated with PBS (mock) or EMCV (1 × 10⁶) for 48 h. Red arrows indicate positive cells. E Scale bar, 500 μm; (F and G) scale bar, 100 μm. ∗p < 0.05, ∗∗p < 0.01, and ∗∗∗p < 0.001, using unpaired Student’s t test (B–D) or log rank (Mantel-Cox) test (A). Data based on one representative experiment performed in three biological replicates from at least three independent experiments (mean ± SD) or representative data (A, E, F, and G). |