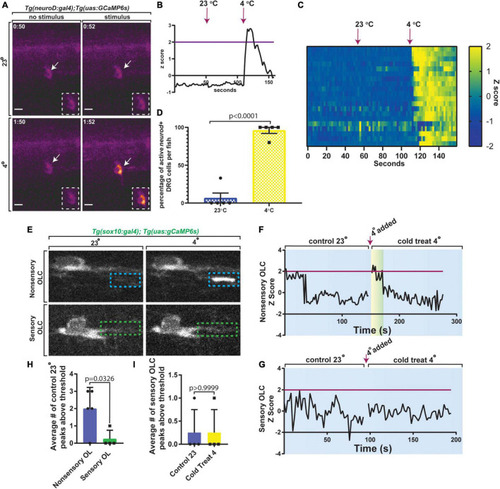
Sensory-related OLCs display distinct Ca2+ transients compared to non-sensory-related OLCs. (A) Images of Tg(neurod:gal4); Tg(uas:gCaMP6s) at 3 dpf showing calcium transients in DRG neurons after exposure to 23 or 4°C water. (B) Quantification of the Z Score of gCaMP6s intensity over time. Magenta line indicates Z score threshold above 2. Magenta arrow indicates the point at which 23 or 4°C water was added. (C) Heatmap representing each DRG neuron and the relative change in gCaMP6s intensity between exposure of 23 or 4°C water over time. (D) Quantification of the percentage of active DRG neuroD+ cells per animal in 23°C control temperature compared to 4°C water (p < 0.0001). (E) Images from a 3 min time-lapse in Tg(sox10:gal4); Tg(uas:gCaMP6s) zebrafish showing calcium transients in non-sensory-related OLCs compared to sensory-related OLCs upon exposure to 4°C water. Blue dashed boxes indicate the region of Ca2+ transient activity in non-sensory-related OLCs. Green dashed boxes indicate lack of Ca2+ transient activity in sensory-related OLCs. (F) Quantification of Z Score representing Ca2+ transient activity in non-sensory-related OLCs upon exposure to 4°C water. (G) Quantification of Z Score representing the lack of Ca2++ transient activity in sensory-related OLCs upon exposure to 4°C water. Magenta line indicates standard deviation threshold above 2 and magenta arrow indicates the point at which 4°C water was added in both F and G. Any peak above this magenta line indicates a positive peak value for calcium expression. (H) Quantification of the average number of control 23°C peaks above threshold in sensory-related OLCs versus non-sensory-related OLCs (p = 0.0326). (I) Quantification of the average number of sensory-related OLCs peaks above the threshold in control 23°C versus 4°C water animals (p > 0.9999). Scale bar equals 10 μm (A,E). All images are orientated anterior to left, posterior to right, dorsal up and ventral down.
|
