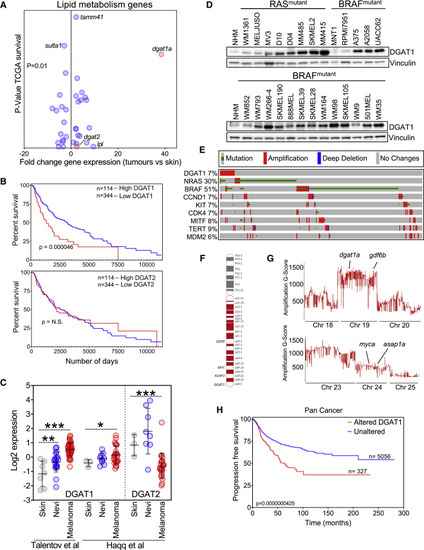
Figure 1. DGAT1 amplification and up-regulation is associated with poor prognosis in melanoma (A) Patient survival from TCGA melanoma cohort (25% top versus 75% bottom by mRNA abundance, y axis) versus fold change in mRNA expression of lipid metabolism genes in zebrafish tumors (x axis). (B) Kaplan-Meier survival plot comparing melanoma patients based on expression of DGAT1 or DGAT2 (top 25% versus bottom 75%, TCGA dataset). (C) DGAT1 and DGAT2 relative gene expression in skin, nevi, and melanoma tumors from indicated studies. Mean ± SD, n > 3. ∗p < 0.05, ∗∗p < 0.01, and ∗∗∗p < 0.001. (D) Protein expression of DGAT1 and vinculin (loading control). NHM, normal human melanocytes. (E) Genetic alterations in the TCGA firehose legacy melanoma dataset (counting only samples with CNV data) obtained from cBioPortal. (F) Schematic depicting human chromosome 8, the amplified arm (red), and known/putative melanoma oncogenes within this region. (G) G-score of amplified regions of zebrafish chromosomes found in BRAFV600E-positive; tp53 mutant tumors indicating the position of presumed melanoma oncogene homologs. (H) Kaplan-Meier progression free-survival plot comparing patients across multiple cancer types based on DGAT1 amplification.
|
