
Fig. 7
- ID
- ZDB-FIG-220623-18
- Publication
- Papadaki et al., 2022 - Dual-expression system for blue fluorescent protein optimization
- Other Figures
- All Figure Page
- Back to All Figure Page
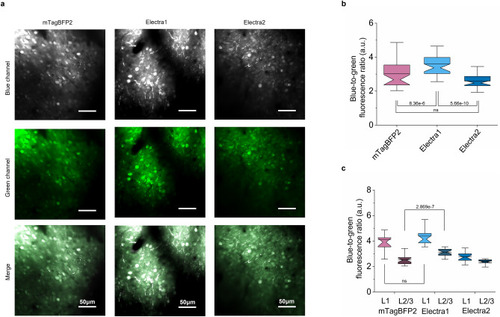
Comparison of EBFP2, mTagBFP2, Electra1, Electra2 in mouse cortex in vivo. (a) In vivo two-photon microscopy of cortex neurons co-expressing mTagBFP2, Electra1, or Electra2 with EGFP in live mice. Representative images of mTagBFP2, Electra1, Electra2 from cortex layer2/3 (~ 350 μm depth). The dynamic range was adjusted independently to facilitate visualization. (b) Blue-to-green fluorescence comparison in live mouse cortex neurons (L1 and L2/3) at P21 after injection expressing mTagBFP2, Electra1, Electra2 (n = 38, 43, 38 neurons, respectively, from one mouse each; Kruskal–Wallis ANOVA p-value = 9.63e-10, post-hoc Kolmogorov-Smirnoff p-values shown in graph; Supplementary Table S9). (c) Blue-to-green fluorescence ratio comparison in live mouse cortex presented independently for L1 and L2/3 (nL1 = 12, 16, 21 neurons for mTagBFP2, Electra1 and ELectra2, respectively; Kruskal–Wallis ANOVA p-valueL1 = 7.7e-8; post-hoc KS p-values shown in graph; nL2/3 = 26, 27, 17 neurons for mTagBFP2, ELectra1 and ELectra2, respectively; KW ANOVA p-valueL2/3 = 1.04e-9; post-hoc KS p-values shown in graph; Supplementary Table S9). |