
FIGURE
Fig. 7
- ID
- ZDB-FIG-220622-56
- Publication
- Pan et al., 2022 - Single-cell transcriptomic analysis of neuroepithelial cells and other cell types of the gills of zebrafish (Danio rerio) exposed to hypoxia
- Other Figures
- All Figure Page
- Back to All Figure Page
Fig. 7
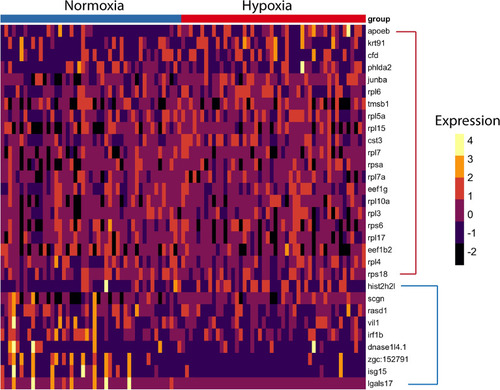
Differential gene expression analysis of NECs between normoxic and hypoxic conditions using the DEsingle method. Heatmap of highly enriched genes that were statistically significant (P < 0.05) in both normoxic and hypoxic conditions in the NEC cluster. Genes enclosed in the red bracket were significantly expressed in hypoxia. Genes enclosed in the blue bracket were significantly expressed in normoxia. |
Expression Data
Expression Detail
Antibody Labeling
Phenotype Data
Phenotype Detail
Acknowledgments
This image is the copyrighted work of the attributed author or publisher, and
ZFIN has permission only to display this image to its users.
Additional permissions should be obtained from the applicable author or publisher of the image.
Full text @ Sci. Rep.