
Fig. 5
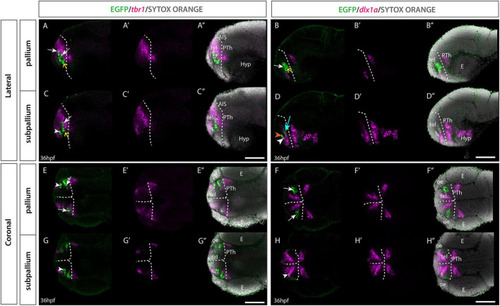
Et(gata2:EGFP)bi105 line expression in combination with tbr1 and dlx1a markers. Sagittal (A–D″) and horizontal (E–H″) sections through a 36hpf Et(gata2:EGFP)bi105 fish labeled with anti-GFP (green) and FISH for tbr1 (magenta) (A,A″,C,C″,E,E″,G,G″) or dlx1a (magenta) (B,B″,D,D″,F,F″,H,H″) with cell nuclei stained with sytox orange (gray). All images are single confocal z-slices taken from volumes, rostral to the left. White arrows indicate pallial EGFP+ cells that express tbr1 and do not express dlx1a. White arrowheads indicate subpallial EGFP+ cells that express dlx1a and do not express tbr1. Yellow arrows indicate EGFP+ cells located ventral in the pallial domain [population B] that do not express tbr1 or dlx1a. (D) Orange arrowhead shows a subpallial EGFP+ cell that does not express dlx1a. Cyan arrow shows a medial pallial cell that expresses dlx1a. Dotted white line indicates the telencephalic ventricle. Scale bars: 50 μm. |