Fig. 7
|
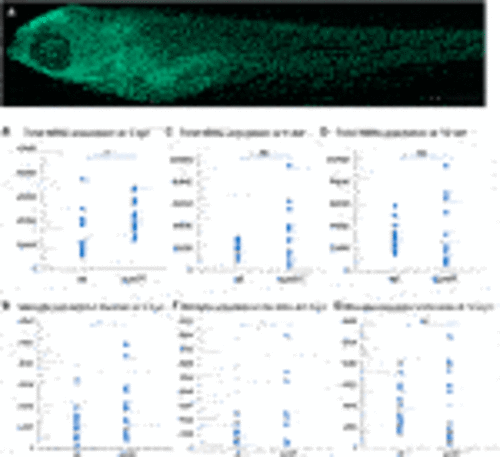
FIGURE 7. Quantification and distribution of microglia and macrophages. (A) Wildtype and sumf1−/− larvae were immunostained with an antibody to detect microglia and macrophages. Scalebar represents 200 μm. The total number of microglia and macrophages (Mi/Ma) was quantified at 3, 5, and 10 d.p.f. by analysing maximum intensity projections of a Z-stack through the entire larva. (B) At 3 d.p.f., there was a significant increase in the Mi/Ma population in sumf1−/− larvae compared to wildtype larvae. However, these differences did not persist at (C) 5 d.p.f. and (D) 10 d.p.f. (E–G) The brain resident population of labelled cells (assumed to by microglia) was quantified at 3, 5, and 10 d.p.f. The brain was selectively quantified by selecting the same Region of Interest (ROI) targeting the frontal and the dorsal brain in all images. There was a significant increase in the microglia population in sumf1−/− larvae at (E) 3 d.p.f. and (F) 5 d.p.f. but no difference at 10 d.p.f. (G). Two-tailed t-test with p-values are denoted as follows: ns: p > 0.05, *: p ≤ 0.05, **: p ≤ 0.01, and ***: p ≤ 0.001. Means values are indicated by the line. |
| Fish: | |
|---|---|
| Observed In: | |
| Stage Range: | Protruding-mouth to Days 7-13 |

